
 EUR/USD" title="EUR/USD" width="734" height="509">
 The pair is trading near the same level since yesterday, holding below 1.28-1.2825 broken support and the 200-days SMA, however above 1.2750 level major support and the last downside barrier. A break below 1.2750 will confirm further downside and a shift in the short-term trend from side-ways to bearish. Accordingly, we need to see price get out of this tight range between 1.2825 and 1.2750 before deciding the next potential direction.
The trading range for today is expected among key support at 1.2750 and key resistance at 1.3000.
The general trend over the short-term is to the downside targeting 1.1865 as far as areas of 1.3550 remain intact. 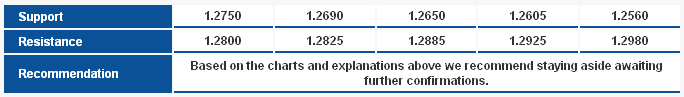 EUR/USD_S&R" title="EUR/USD_S&R" width="684" height="97">
GBP/USD GBP/USD" title="GBP/USD" width="734" height="509">
The price traded narrowly after settling below 1.6000 level, while momentum continues to be slightly negative however with a ranging bias as seen on RSI and Stochastic. The recent false break above the descending resistance of the declining channel shown on image suggests we may see further pressure towards the 200-days SMA and near the other side of the channel. Accordingly, we remain bearish for today.
The trading range for today is expected among key support at 1.5850 and key resistance at 1.6170.
The general trend over the short-term is to the downside targeting 1.4225 as far as areas of 1.6875 remain intact. 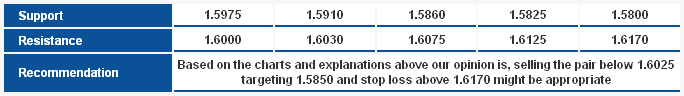 GBP/USD_S&R" title="GBP/USD_S&R" width="684" height="96">
USD/JPY USD/JPY" title="USD/JPY" width="734" height="509">
The pair continued to move lower following the retest of 80.60 key resistance and major high. A bearish divergence on Stochastic accompanies the pullback and suggests we may see further weakness. However, a potential support and re-entry area resides near the 200-days SMA and around 79.60 level. Therefore, we expect the latest bullish wave to resume after testing 79.60 region.
The trading range for today is expected among key support at 79.50 and key resistance now at 80.60.
The general trend over the short-term is to the upside targeting 87.45 as far as areas of 75.20 remain intact. 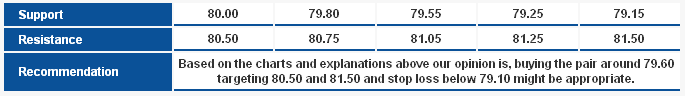 USD/JPY_S&R" title="USD/JPY_S&R" width="685" height="96">
USD/CHF USD/CHF" title="USD/CHF" width="734" height="509">
The pair turned to the upside as expected and currently forming the CD leg of the suggested Butterfly Pattern. The first Potential Reversal Zone (PRZ) resides at 0.9490 and the second at 0.9570 and we believe that the upside move will extend today, and the failure to breach of 0.9400 keeps the upside wave limited.
The trading range for today is among key support at 0.9300 and key resistance at 0.9570.
The general trend over the short-term is to the downside targeting 0.8860 as far as areas of 0.9775 remains intact. 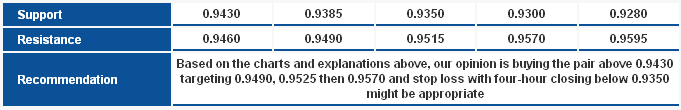 USD/CHF_S&R" title="USD/CHF_S&R" width="681" height="110">
USD/CAD USD/CAD" title="USD/CAD" width="734" height="509">
The upside attempts remained limited yesterday below the Potential Reversal Zone (PRZ) for the bearish Butterfly Pattern and below the Linear Regression Indicator 34. Therefore, we believe the pair will move to the downside again toward the targets of the pattern which initially start at 0.9910 which is the 38.2% correction of CD leg of the pattern. Breaching this level will extend the targets toward 61.8% correction at 0.9840 passing through the minor support at 0.9875, where this bearish outlook requires stability below 1.0040.
The trading range for today is among the key support at 0.9800 and key resistance at 1.0040.
The short-term trend is expected to the downside with daily closing below 1.0125 targeting areas of 0.9400. 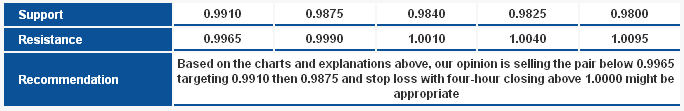 USD/CAD_S&R" title="USD/CAD_S&R" width="684" height="111">
AUD/USD AUD/USD" title="AUD/USD" width="734" height="509">
From areas around the 1.0330 support, the pair rebounded to the upside sharply approaching our suggested targets; the pair is now stable above the Linear Regression Indicators and above the minor resistance at 1.0412. We expect the pair to extend the upside move but first it must confirm stability above 61.8% correction at 1.0440. Momentum indicators are offering overbought signals which might cause volatility and downside corrections yet trading above 1.0330 will keep the bullishness intact and extend the upside move over intraday basis and coming days.
The trading range for today is expected among the key support at 1.0300 and resistance at 1.0560.
The short-term trend is to the downside targeting 0.9400 with steady daily closing below 1.0710. 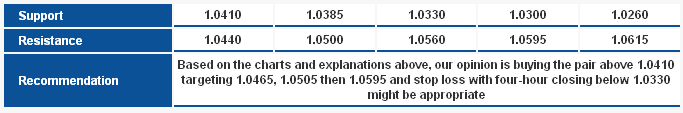 AUD/USD_S&R" title="AUD/USD_S&R" width="683" height="113">
NZD/USD NZD/USD" title="NZD/USD" width="734" height="509">
Despite the weakness seen on the pair, it is still trading above the Linear Regression Indicators 34 and 55 and also above the main ascending support for the bullish channel. Therefore, we see that the bullishness remains likely over intraday basis and coming days as well as far as trading is above 0.8185 over intraday basis today.
The trading range for today is expected among the key support at 0.8135 and resistance at 0.8420.
The short-term trend is to the upside targeting 0.8400 with steady daily closing above 0.7930. 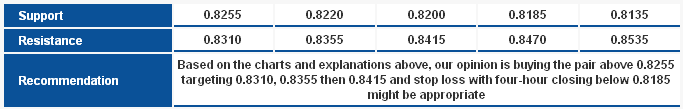 NZD/USD_S&R" title="NZD/USD_S&R" width="683" height="109">
Technical Crosses
GBP/JPY GBP/JPY" title="GBP/JPY" width="734" height="509">
The bearish bias is still seen on the pair and Stochastic reflects the negativity at the time the pair stabilizes below the Linear Regression Indicators which also limits their positive impact. The possibility for the pair to extend the downside move is likely but the risk to reward ratio is inappropriate. The downside move requires stability below 129.05 and this level is far from current trading areas, and especially when comparing the need to breach 126.85 to extend the downside move and therefore we remain neutral for today.
The trading range for today is among the major support at 126.15 and the major resistance at 129.05.
The short-term trend is to the downside as far as 112.00 remains intact targeting 150.00. 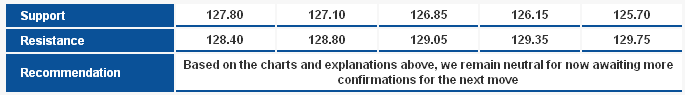 GBP/JPY_S&R" title="GBP/JPY_S&R" width="685" height="95">
EUR/JPY EUR/JPY" title="EUR/JPY" width="734" height="509">
We have a possible Double Top formation supported by the negative momentum and Linear Regression Indicators alongside stability below 102.60. Trading below this level might extend the bearishness, but we can also see that trading is near the main support for the upside wave and accordingly we can’t confirm the extension of the downside move. Therefore, we prefer to stay aside awaiting more confirmations.
The trading range for today is among key support at 100.75 and key resistance now at 103.70.
The general trend over the short-term is to the upside targeting 109.15 as far as areas of 98.75 remain intact with weekly closing.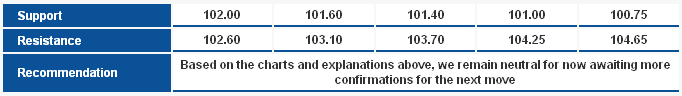 EUR/JPY_S&R" title="EUR/JPY_S&R" width="682" height="96">
EUR/GBP EUR/GBP" title="EUR/GBP" width="734" height="509">
There is no doubt that the Head and Shoulders formation is negative, as the pair is stable below the neckline of the pattern and below the main ascending support which is accompanied with a negative crossover on the Linear Regression Indicators and they are also biased negatively.
The pair must consolidate below the neckline for the pattern and that means stability below 0.8030 which is the resistance level around the neckline and the EMA 50 and also near the ascending support that was breached and turned into resistance. We might see the extension of the downside move in the coming days yet over intraday basis we do not rule out the possibility for high volatility with attempts for a positive crossover on Stochastic.
The trading range for today is among the key support at 0.7900 and key resistance now at 0.8100.
The general trend over the short-term is to the upside targeting 1.0370 as far as areas of 0.7785 remain intact. 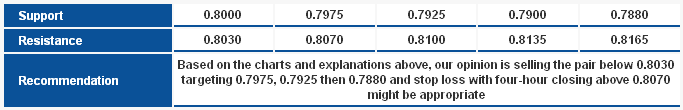 EUR/GBP_S&R" title="EUR/GBP_S&R" width="683" height="110">