
 EUR/USD" title="EUR/USD" width="582" height="348">
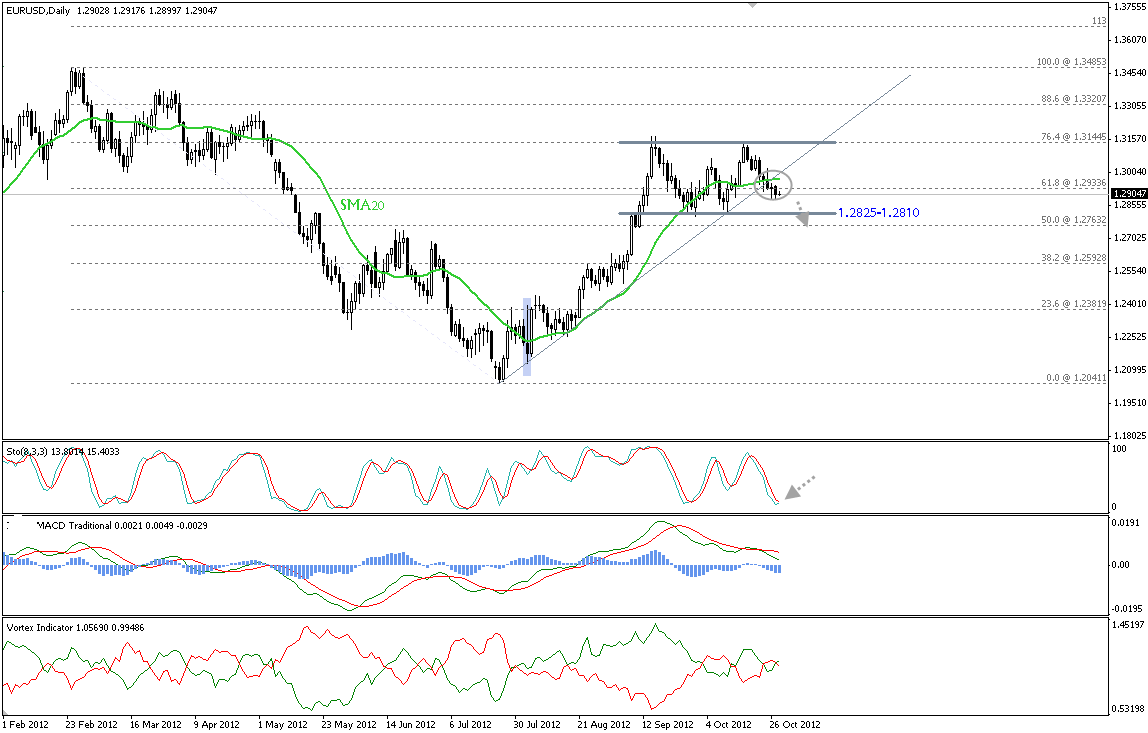
 Despite the narrow trading range, the pair started the week with bearish tendencies achieving a new daily closing below 61.8% Fibonacci level and also below SMA 20 as seen on the provided daily graph. The pair should manage to set up lower mainly targeting 1.2810 areas followed by the major target of our classical study at 1.2750. Stochastic may cause slight upside corrections but the bearish momentum is strong enough to keep the pair moving downwards.
The trading range for today is among key support at 1.2700 and key resistance at 1.3080.
The general trend over the short-term is to the downside targeting 1.1865 as far as areas of 1.3550 remain intact.  EUR/USD_S&R" title="EUR/USD_S&R" width="684" height="96">
GBP/USD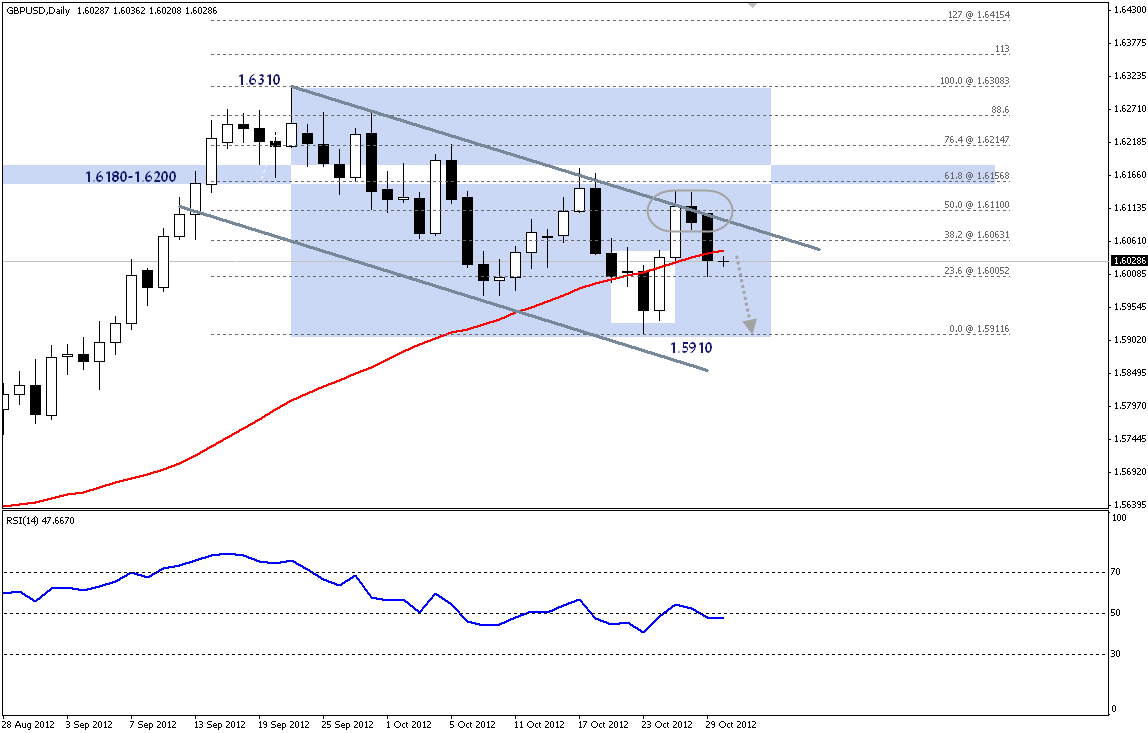 GBP/USD" title="GBP/USD" width="583" height="349">
The GBP/USD pair has slipped after touching the 1-month bearish trend line which met 50% Fibonacci of the entire downside wave from 1.6310 to 1.5910 as seen on the provided daily chart. This collapse has formed a long black candlestick formation assisting bears to achieve a daily closing below SMA 50. Thereby, further losses could be seen over upcoming hours mainly targeting 1.5910-1.5900 support zones.
The trading range for today is among key support at 1.5820 and key resistance at 1.6200.
The general trend over the short-term is to the downside targeting 1.4225 as far as areas of 1.6875 remain intact.  GBP/USD_S&R" title="GBP/USD_S&R" width="686" height="94">
USD/JPY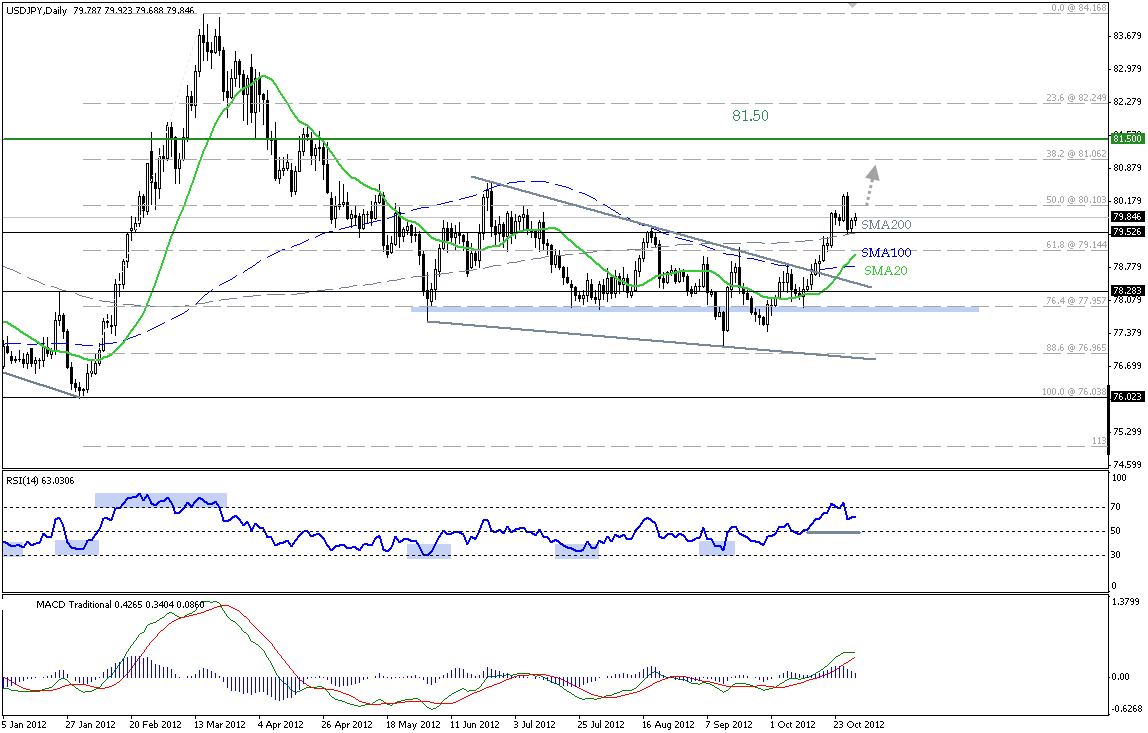 USD/JPY" title="USD/JPY" width="563" height="337">
Agreeing with yesterday’s proposed scenario, the pair moved to the upside once again after touching SMA 200 which met the previous broken resistance -turned into support- at 79.55 as seen on the provided daily chart. We hold onto our bullish predictions which are based on the bullish effect of our successful falling wedge as far as 78.60-78.50 hold. Note that a break above 80.00 psychological level will confirm and accelerate the move.
The trading range for today is among key support at 78.50 and key resistance now at 81.05.
The general trend over the short-term is to the upside targeting 87.45 as far as areas of 75.20 remain intact. 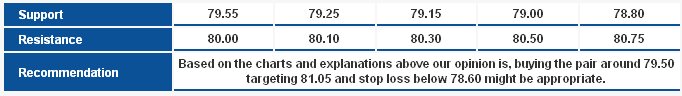 USD/JPY_S&R" title="USD/JPY_S&R" width="682" height="96">
USD/CHF USD/CHF" title="USD/CHF" width="606" height="363">
The thin trading is still biased positively as the pair is gradually approaching 23.6% correction at 0.9395 which if breached will extend the upside move toward 0.9430 . The Linear Regression Indicators 34 and 55 and both now trading with upside bias and that might extend the upside move yet Stochastic is trading in overbought areas which might cause volatility and a slight downside correction.
The trading range for today is among key support at 0.9235 and key resistance at 0.9505.
The general trend over the short-term is to the downside targeting 0.8860 as far as areas of 0.9775 remains intact. 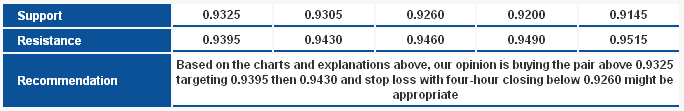 USD/CHF_S&R" title="USD/CHF_S&R" width="684" height="111">
USD/CAD USD/CAD" title="USD/CAD" width="593" height="329">
The overbought signs on Stochastic signal that the pair might reverse from around 1.0040 which is the first potential reversal zone (PRZ) for the potential bearish butterfly pattern. We do not rule out the possibility for the pair to reach the second PRZ at 1.0135. For today, we expect a downside move if the pair managed to breach 0.9990 support as stability below this level is required to cancel the possibility of reaching the second PRZ.
The trading range for today is among the key support at 0.9800 and key resistance at 1.0045.
The short-term trend is expected to the downside with daily closing below 1.0125 targeting areas of 0.9400. 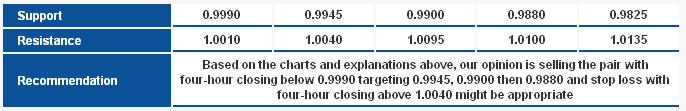 USD/CAD_S&R" title="USD/CAD_S&R" width="686" height="111">
AUD/USD AUD/USD" title="AUD/USD" width="598" height="358">
The thin trading did not push the pair out of the tight trading range between the Linear Regression Indicators 34 and 55 and that is accompanied also by sideways trading on RSI around 50 areas. The current trading range forces us to stay neutral for now and wait for more confirmations due to the inappropriate risk to reward ratio. The breach of 1.0330 will trigger a downside wave while the breach of 1.0385 will support a new upside wave.
The trading range for today is expected among the key support at 1.0165 and resistance at 1.0465.
The short-term trend is to the downside targeting 0.9400 with steady daily closing below 1.0710. 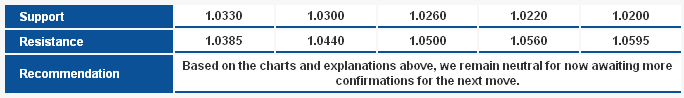 AUD/USD_S&R" title="AUD/USD_S&R" width="684" height="98">
NZD/USD NZD/USD" title="NZD/USD" width="563" height="337">
Despite the downside move yesterday, the pair remained steady above 0.8185 and above 0.8200 and that keeps the positivity supported by stability above the main support for the upside wave and the breach of the resistance for the minor downside wave. Stochastic is negative and at the same time trading above 0.8135 will trigger a new upside wave today and in the coming period.
The trading range for today is expected among the key support at 0.8100 and resistance at 0.8355.
The short-term trend is to the upside targeting 0.8400 with steady daily closing above 0.7930. 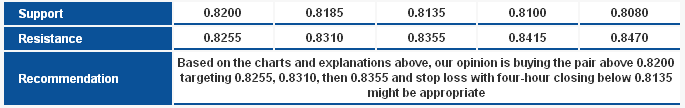 NZD/USD_S&R" title="NZD/USD_S&R" width="685" height="108">
Technical Crosses
GBP/JPY  GBP/JPY" title="GBP/JPY" width="601" height="360">
The pair is still trading bearishly and Stochastic is negative and trending to the downside. We still cannot support the extension of the downside move since the pair is stable above the second target of the bullish Bat Patter at 61.8% correction of CD leg which resides at 126.85 areas and accordingly we will also stay aside for today.
The trading range for today is among the major support at 126.15 and the major resistance at 129.05.
The short-term trend is to the downside as far as 112.00 remains intact targeting 150.00. 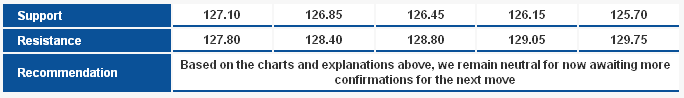 GBP/JPY_S&R" title="GBP/JPY_S&R" width="684" height="98">
EUR/JPY EUR/JPY" title="EUR/JPY" width="595" height="356">
The pair is currently trading bearishly below 102.60 areas and the negativity on Stochastic is also seen with the negative crossover in overbought areas. Stability below the mentioned areas will extend the intraday bearishness to retest the ascending support on the chart. The Linear Regression Indicators are negative supporting our expectations.
The trading range for today is among key support at 100.75 and key resistance now at 103.70.
The general trend over short term basis is to the upside targeting 109.15 as far as areas of 98.75 remain intact with weekly closing.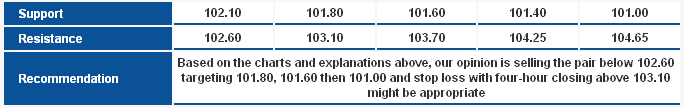 EUR/JPY_S&R" title="EUR/JPY_S&R" width="684" height="108">
EUR/GBP EUR/GBP" title="EUR/GBP" width="660" height="396">
Despite the upside reversal in the past sessions from the main ascending support, we still need to see the pair stabilize above 0.8070 support to confirm returning above the downside trend-line. The Linear Regression Indicators are negative now and the conflicts with the stability above the EMA 50 and accordingly we prefer to stay neutral today waiting for more confirmations.
The trading range for today is among the key support at 0.7925 and key resistance now at 0.8135.
The general trend over short term basis is to the upside targeting 1.0370 as far as areas of 0.7785 remain intact. 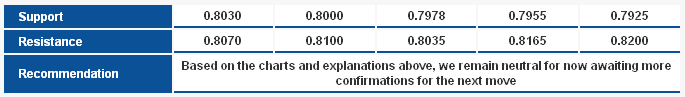 EUR/GBP_S&R" title="EUR/GBP_S&R" width="685" height="97">