
EUR/USD
 EUR/USD" title="EUR/USD" width="600" height="600">
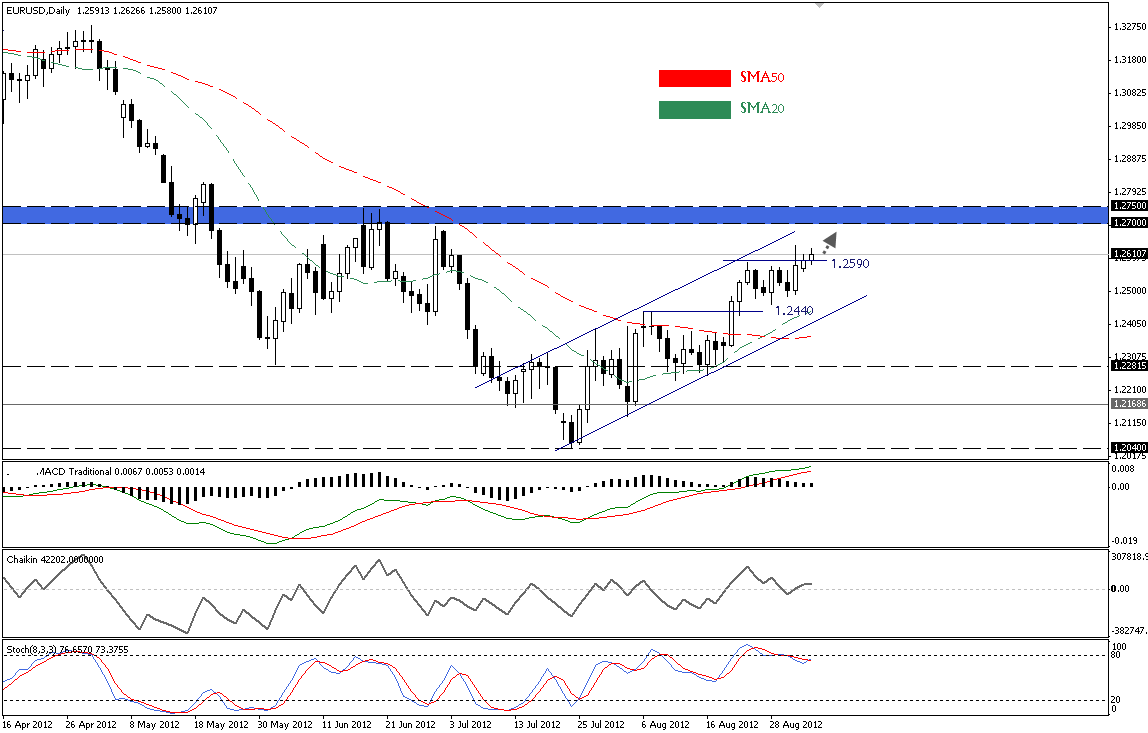
Finally, the pair started to stabilize above 1.2590 as seen on the provided daily chart. Classically speaking, bulls have the ability now to retest 1.2700 followed by 1.2750 zones after clearing the aforesaid resistance; noting that, we still classify the movements from the significant low of 1.2040 as a correction for the drop from 1.3280 region. Stochastic may cause fluctuation as it is very close to overbought territories. On the downside, clearing 1.2500 zones will weaken 1.2440 and a break this support will be an indication for resuming the major bearish direction.
The trading range for today is among key support at 1.2460 and key resistance at 1.2750.
The general trend over short-term basis is to the downside targeting 1.1865 as far as areas of 1.3550 remain intact. 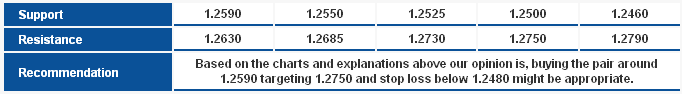 EUR/USD_S&R" title="EUR/USD_S&R" width="682" height="94">
GBP/USD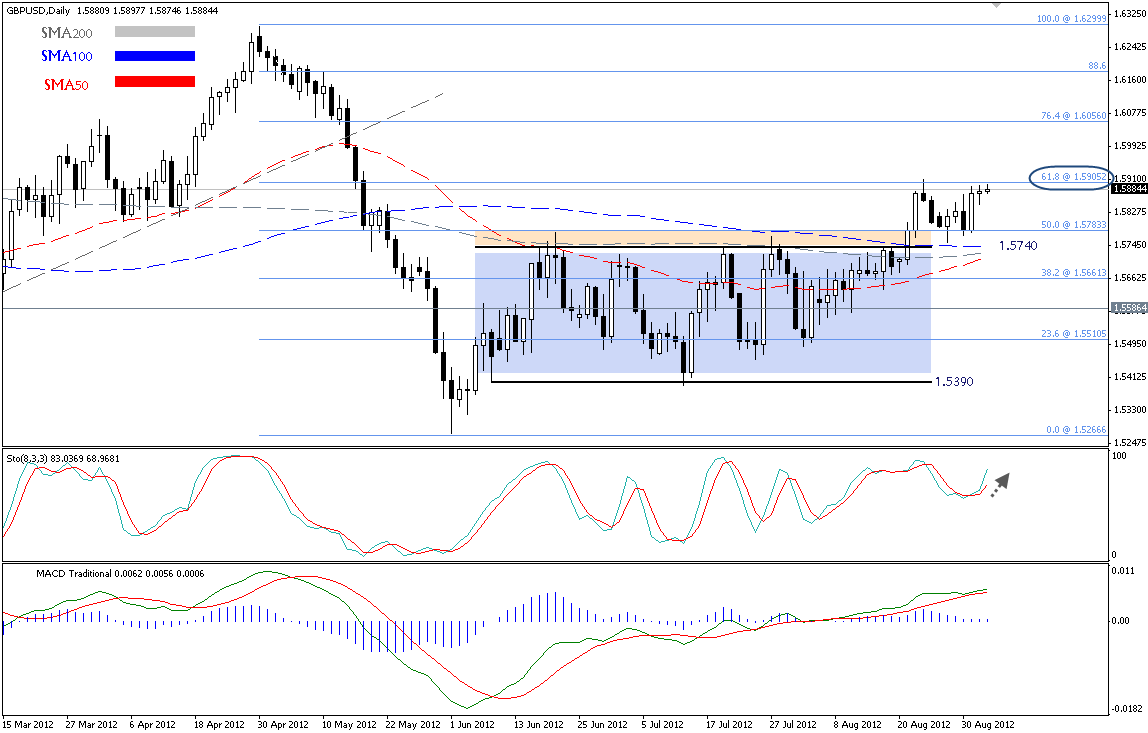 GBP/USD" title="GBP/USD" width="600" height="600">
The pair remains trapped within a very tight range following the past Friday’s upside actions as seen on the provided daily graph. The positivity on Stochastic couldn’t assist traders to send the pair higher above 61.8% Fibonacci retracement and thus, we remain neutral over intraday basis. On the other hand, coming below 1.5780 will threaten the recently created floor at 1.5740.
The trading range for today is among key support at 1.5660 and key resistance at 1.6075.
The general trend over short-term basis is to the downside targeting 1.4225 as far as areas of 1.6875 remain intact. 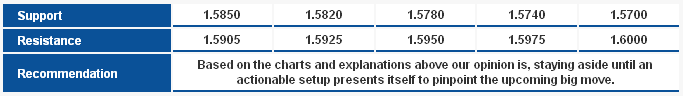 GBP/USD_S&R" title="GBP/USD_S&R" width="683" height="96">
USD/JPY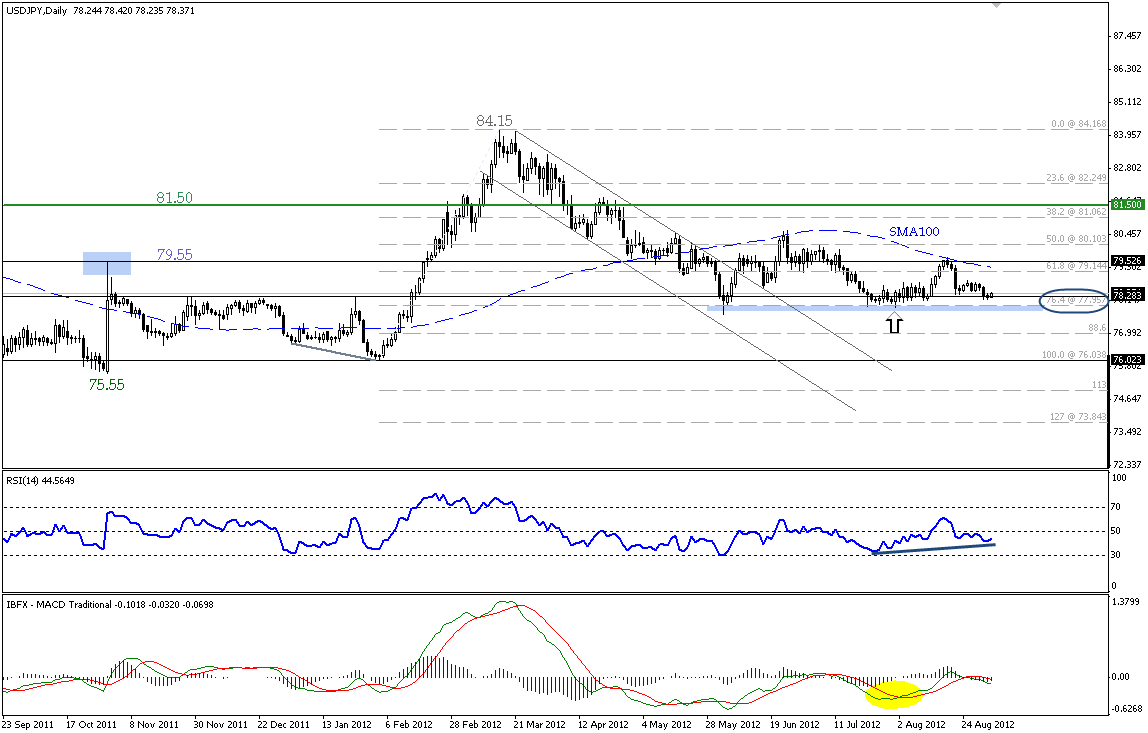 USD/JPY" title="USD/JPY" width="600" height="600">
The pair didn’t show any big move since the opening of this week creating a case of indecision as it remains stable above 76.4% Fibonacci retracement of the entire upside wave from 76.00 to 84.15. Hence, we hold onto our neutrality noting that, a break below 77.95 will trigger a panic sell-off action. On the other side, bulls power could be stronger with a break above 79.15.
The trading range for today is among key support at 77.30 and key resistance now at 79.55.
The general trend over short-term basis is to the upside targeting 87.45 as far as areas of 75.20 remain intact. 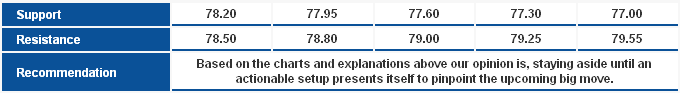 USD/JPY_S&R" title="USD/JPY_S&R" width="680" height="93">
USD/CHF USD/CHF" title="USD/CHF" width="600" height="600">
The pair provided a daily closing below 0.9520 and that further supports the pressure from the Butterfly Pattern. Accordingly to the harmonic rules the pair might rush to the downside now to test the bottom C set at 0.9460 and maybe 113% correction at 0.9395 and then the second extended target at 0.9325 shown above. This negative outlook requires stability below the first extended target at 0.9570 today. Stochastic is biased negatively despite approaching oversold areas to further support our expectations.
The trading range for today is among key support at 0.9325 and key resistance at 0.9680.
The general trend over short-term basis is to the upside targeting 1.0420 as far as areas of 0.9400 remains intact. 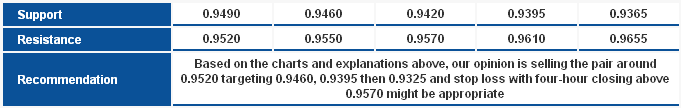 USD/CHF_S&R" title="USD/CHF_S&R" width="681" height="108">
USD/CAD USD/CAD" title="USD/CAD" width="600" height="600">
Despite the tight trading range but we can see stability below 88.6% correction at 0.9870 which keeps the possibility for the downside move intact . The Linear Regression Indicator 34 that is biased positively is limiting the negativity, yet stability below the level mentioned might negate the effect and push the pair further to the downside. Stochastic is trading in oversold areas and shows signs of upside reversal and RSI is stable below 50 which support our expectations for today.
The trading range for today is among key support at 0.9715 and key resistance at 1.0000.
The short-term trend is expected to the downside with daily closing below 1.0125 targeting areas of 0.9400. 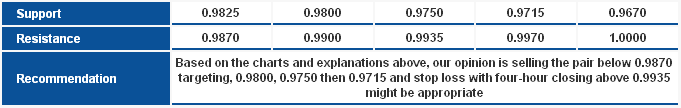 USD/CAD_S&R" title="USD/CAD_S&R" width="681" height="108">
AUD/USD AUD/USD" title="AUD/USD" width="600" height="600">
The downside move stopped at the Potential Reversal Zone (PRZ) that was suggested yesterday at 1.0220 and the pair now is trading positively affected by the positive Bat Pattern. We expect the upside move for the pair to continue and take the pair to test 1.0345 which is the first target of the pattern and might extend further. The positive outlook for today depends on stability above 1.0220 and breaching 1.0178 (trough X of the pattern) can weaken those expectations.
The trading range for today is expected among the key support at 1.0100 and resistance at 1.0400.
The short-term trend is to the downside targeting 0.9400 with steady daily closing below 1.0710. 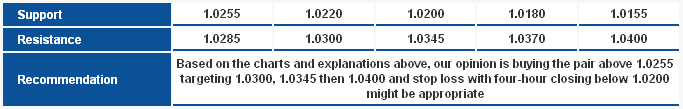 AUD/USD_S&R" title="AUD/USD_S&R" width="683" height="109">
NZD/USD NZD/USD" title="NZD/USD" width="600" height="600">
The pair is stable below 0.7985 and that is negative pressure that will push the pair further to the downside . The breach confirmed the break of the ascending trend line and neckline for the Double Top pattern. The Linear Regression Indicators are negative and MACD is trading below zero and that further supports our expectations that require stability below 0.8040 to remain valid.
The trading range for today is expected among the key support at 0.7855 and resistance at 0.8080.
The short-term trend is to the upside targeting 0.8400 with steady daily closing above 0.7930. 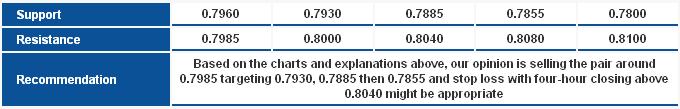 NZD/USD_S&R" title="NZD/USD_S&R" width="680" height="109">
Technical Crosses
GBP/JPY GBP/JPY" title="GBP/JPY" width="600" height="600">
Despite the tight trading range, we can see trading biased to the upside and the Linear Regression Indicators have carried the pair to the upside. The upside bias is influenced by the bullish Butterfly Pattern and stability above the pattern’s second target at 123.75 will extend the bullishness toward extended targets. We hold onto our positive expectations for today, while the breach of 125.00 might trigger a clearer upside move.
The trading range for today is among the major support at 123.20 and the major resistance at 126.80.
The short-term trend is to the downside as far as 150.00 remains intact targeting 112.00. 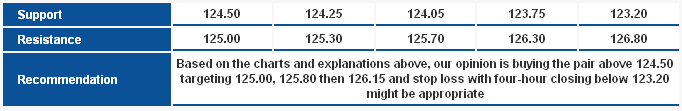 GBP/JPY_S&R" title="GBP/JPY_S&R" width="682" height="111">
EUR/JPY EUR/JPY" title="EUR/JPY" width="600" height="600">
Affected by stability again within the ascending channel and holding above the Linear Regression Indicator, the pair rushed to the upside once again and currently consolidating above 61.8% correction level at 98.60. Stability above the mentioned level might support the extension of the upside move while the general bullish bias require stability above the main support of the ascending channel and the 50% correction at 97.75.
The trading range for today is among key support at 96.90 and key resistance now at 100.80.
The general trend over short-term basis is to the upside targeting 101.60 as far as areas of 93.10 remain intact with weekly closing. 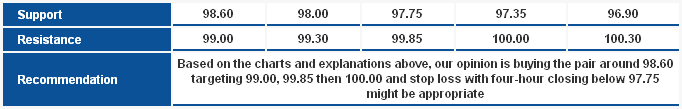 EUR/JPY_S&R" title="EUR/JPY_S&R" width="682" height="109">
EUR/GBP EUR/GBP" title="EUR/GBP" width="600" height="600">
The MA 50 managed to prevent the pair from providing a four-hour closing below it for the past 21 months and that triggered the upside move today as the pair attempts to hold above the Linear Regression Indicator. Stability above 0.7925 is positive and the breach of 61.8% correction at 0.7965 adds more positivity. For today, we expect an upside move as far as we did not see the breach of 0.7880 and stability below it.
The trading range for this week is among the key support at 0.7785 and key resistance now at 0.8100.
The general trend over short-term basis is to the upside targeting 1.0370 as far as areas of 0.7785 remain intact. 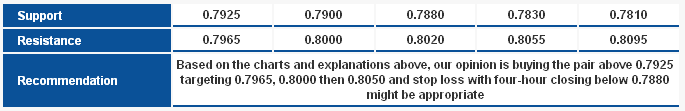 EUR/GBP_S&R" title="EUR/GBP_S&R" width="685" height="111">