Yellen goes (mildly) hawkish
While Fed Chair Janet Yellen’s press conference yesterday didn’t contain any new information, her style of presentation was somewhat more hawkish than before. She seemed to be warning the market that it was being too dovish on rates, much like Bank of England Gov. Carney did recently – and we all know how the pound reacted to his warnings. I believe something similar should happen to the dollar in the not-too-distant future as Yellen’s (and the FOMC’s) vision gradually comes to pass.
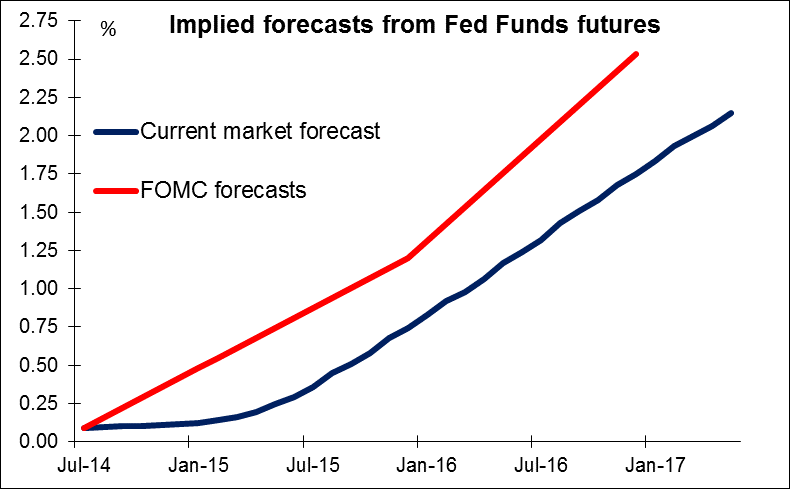
Asked about the timing of the first rate hike, Yellen pointed to the FOMC’s Summary of Economic Projections, in which all the members of the FOMC make their economic forecasts, including the “dots” for the Fed Funds rate, and say when they expect rates to rise. This reference was quite significant, because she had dismissed these dots at her first press conference in March and played them down in May. ““I think that one should not look to the dot plot, so to speak, as the primary way in which the Committee wants to or is speaking about policies to the public at large,” she said back in March. Thus it was a change that she now did point to these forecasts as the main indicator of Fed policy. Also it was a big change from May, when she responded to a similar question by noting simply that "most members believe that in 2015 or 2016 normalization would begin under their baseline outlook." The reason this change is so significant is that the dot plot remains much more aggressive than the market’s forecasts. Even after yesterday, when Fed Funds futures implied interest rates rose 5 bps or so from 2016 outwards, the FOMC forecasts were still 45 bps (= 2 rate hikes) higher than the market for end-2016 and 78 bps (= 3 rate hikes) higher for end-2017. Thus her language this time seemed to be a warning to the market that it was too dovish with regards to rates. To make the point perfectly clear, she also stated that if the labor market continues to improve at its current pace, “then increases in the federal funds rate target likely would occur sooner and be more rapid than currently envisioned.”
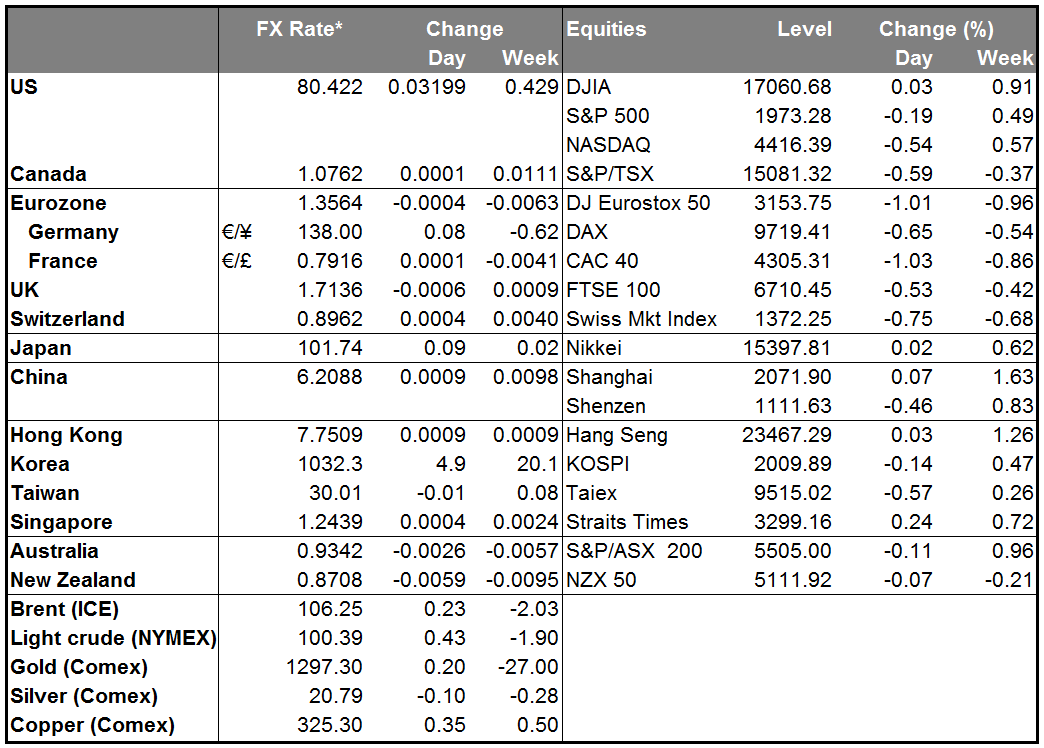
In any case, the market did not miss the implications and the Dollar was up against virtually all currencies yesterday, both G10 and EM. The only exception was the pound, which gained on the dollar after Tuesday’s announcement that UK inflation suddenly jumped in June, making a rate hike seem all the more likely.
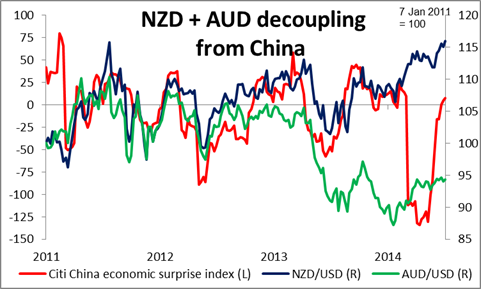
Overnight, China announced some better-than-expected data: 2Q GDP rose 7.5% vs estimates of 7.4%, while June industrial production and first-half fixed asset investment both exceeded projections. Nonetheless AUD and NZD both declined. Part of that may have been due to a statement by China’s National Bureau of Statistics that a downturn in the property market creates short-term pressure on economic growth, a forward-looking statement that may have outweighed the significance of the backward-looking indicators. For NZD, the biggest loser on the day, the decline was due to domestic factors: inflation rose less than expected in Q2 (+1.6% yoy vs expected +1.8%; previous +1.5%) and dairy prices fell further at the latest auction. Both of those facts take some pressure off the Reserve Bank of New Zealand to raise rates. Given the recent slump in agricultural commodity prices, I may have to reassess my bullish stance on the kiwi. I remain bearish AUD.
Today: During the European day, the Riksbank releases the minutes from its latest policy meeting, when it shocked the markets by cutting rates more than expected. SEK has recovered a bit since the meeting, so there’s a chance the details could shock the market again and cause the currency to weaken once again.
From the UK, nation’s unemployment rate for May is forecast to decline to 6.5% from 6.6%. On top of Tuesday’s strong inflation rate for June, and the recent indications of a booming housing market, this figure should work towards lifting UK rate expectations. However, the focus will be probably on average weekly earnings --which are expected to slow in May to +0.5% yoy (three month average) from +0.7% yoy. If wage increases are slowing, the Monetary Policy Committee is likely to conclude that there is still sufficient slack in the economy and there’s no urgent need to tighten.
It’s a busy day in the US. Industrial production and PPI data for June are due out, as well as the National Association of Home Builders (NAHB) market index for July. The Fed releases the Beige book. We also get the MBA mortgage applications for the week ended on the 11th of July. We also have Fed Chair Janet Yellen’s second day testimony to the House on monetary policy. Dallas Fed President Richard Fisher also speaks.
In Canada, the Bank of Canada meets to decide on its interest rates. CAD has been firming on expectations that they will move from a neutral to a tightening bias, but we disagree, especially after last Friday’s higher-than-expected unemployment rate for June. The nation’s manufacturing sales are also coming out.
EU leaders meet in Brussels to consider expanded sanctions against Russia over Ukraine.
The Market
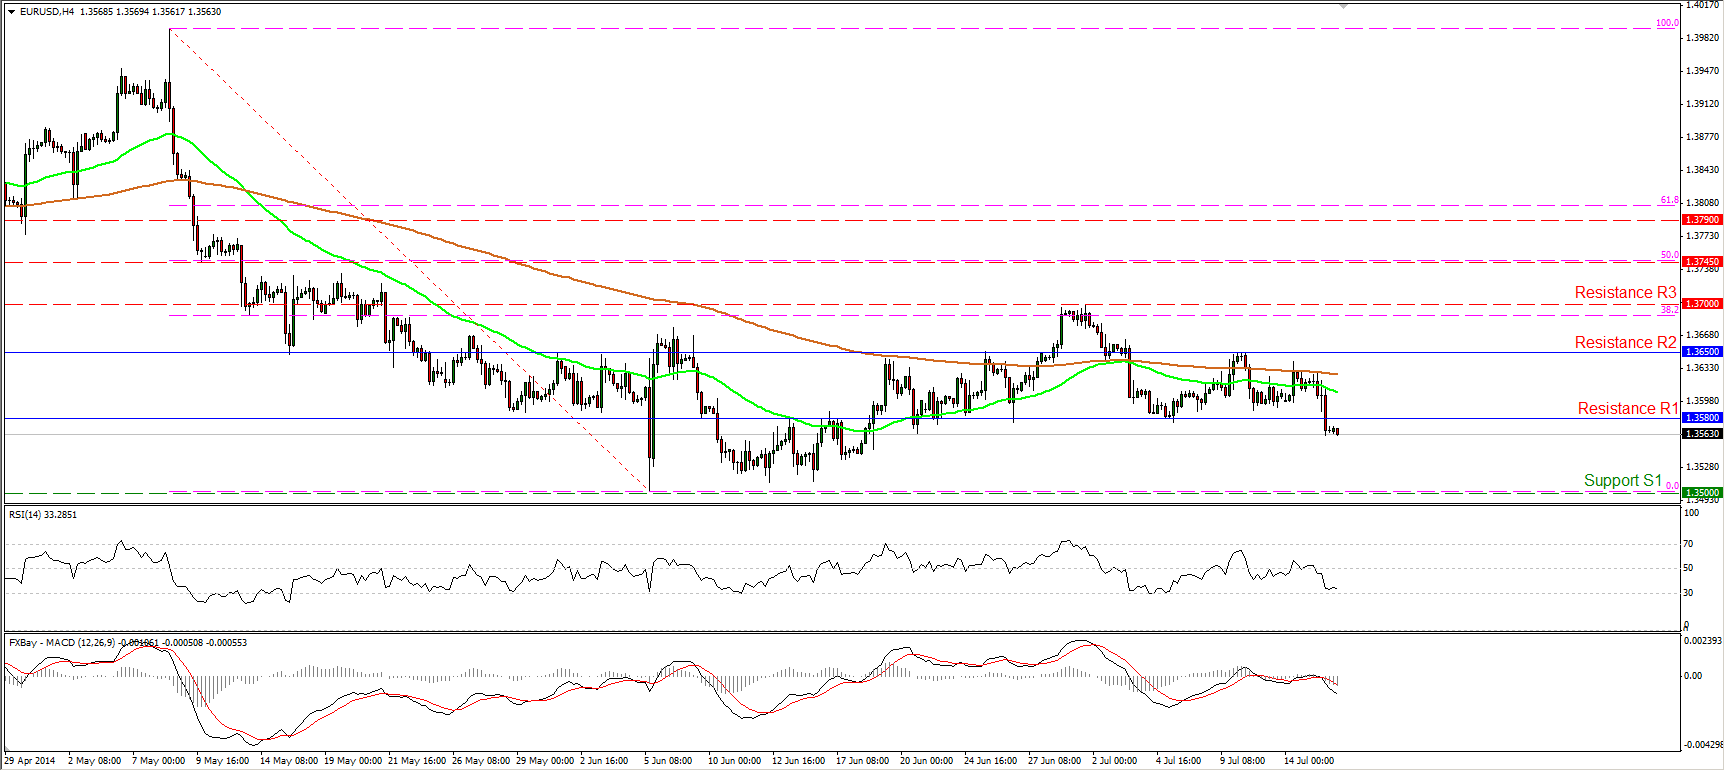
EUR/USD breaks below 1.3580
The EUR/USD declined on Tuesday, violating the 1.3580 barrier, the lower boundary of the recent sideways path it’s been trading recently. I believe that such a dip carries larger bearish extensions and paves the way towards the psychological zone of 1.3500 (S1). In my view, the rate seems to have the necessary momentum to challenge that zone, since the MACD fell below both its zero and signal lines while the RSI has further to go before signaling oversold conditions. On the daily chart the rate is back below the 200-day moving average, while our daily momentum studies moved lower, leaving their neutral levels. Bearing all these indications, I would change my stance from neutral to negative.
• Support: 1.3500 (S1), 1.3475 (S2), 1.3400 (S3).
• Resistance: 1.3580 (R1), 1.3650 (R2), 1.3700 (R3).
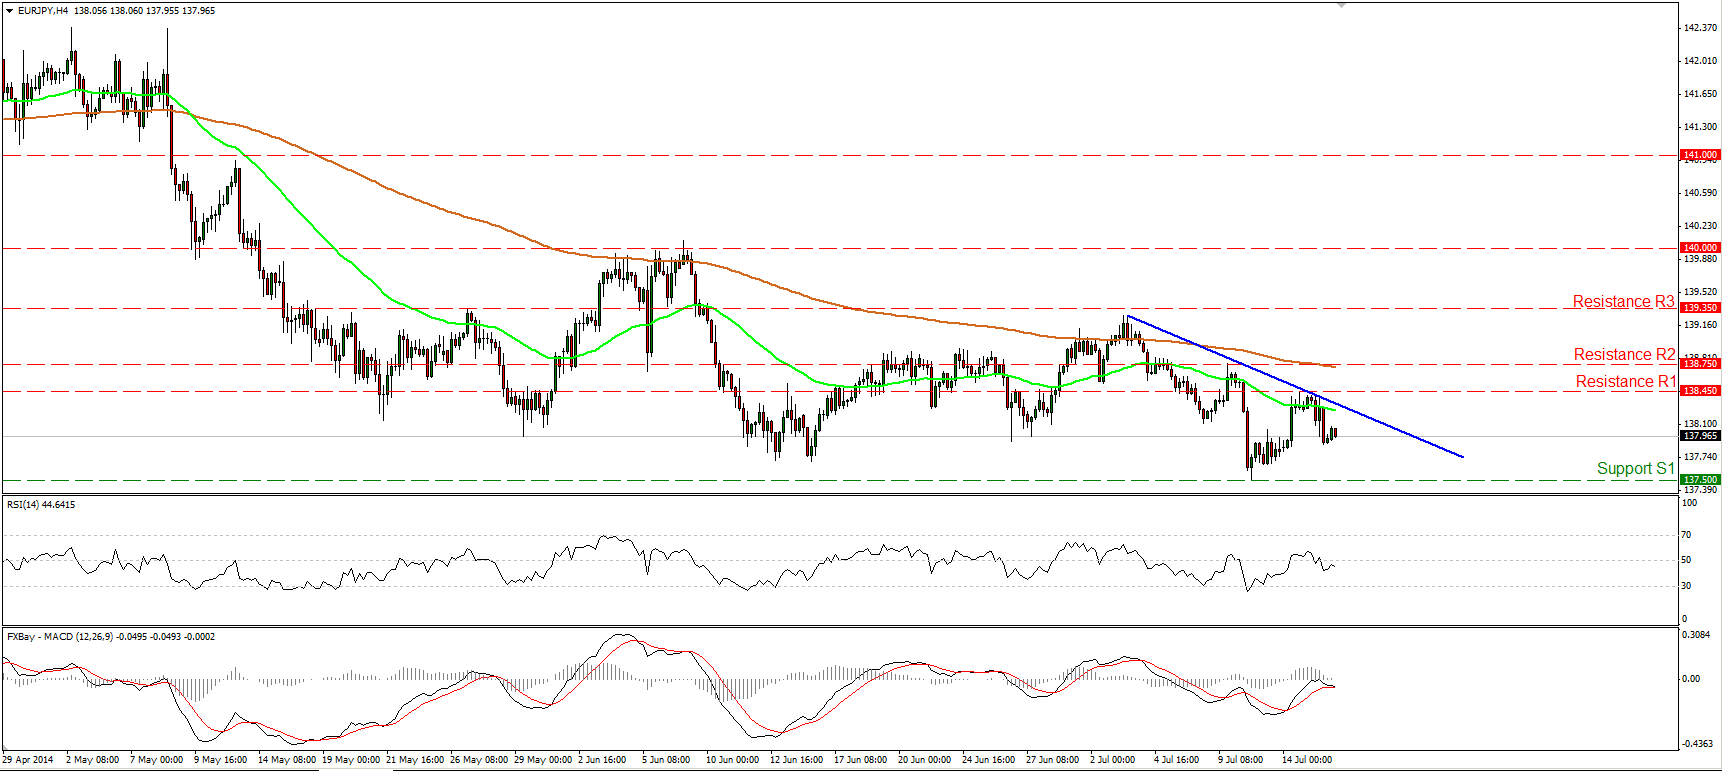
EUR/JPY finds resistance at 138.45
The EUR/JPY moved lower, forming a lower high, after finding resistance at 138.45 (R1). The RSI remains below its 50 level, pointing down, while the MACD, already within its negative zone, seems ready to fall below its signal line. Taking this into account I would expect the rate to continue declining and challenge the support barrier of 137.50 (S1). Nevertheless, we need a clear dip below that level to have a forthcoming lower low and the continuation of the minor term downtrend. On the daily chart, I cannot identify a clear trending structure, thus I would consider the longer-term path of EUR/JPY to be to the sideways. Moreover, the price oscillates between the 50- and the 200-day moving average, which are pointing sideways, corroborating my neutral view as far as the long-term picture is concerned.
• Support: 137.50 (S1), 136.75 (S2), 136.20 (S3).
• Resistance: 138.45 (R1), 138.75 (R2), 139.35 (R3).
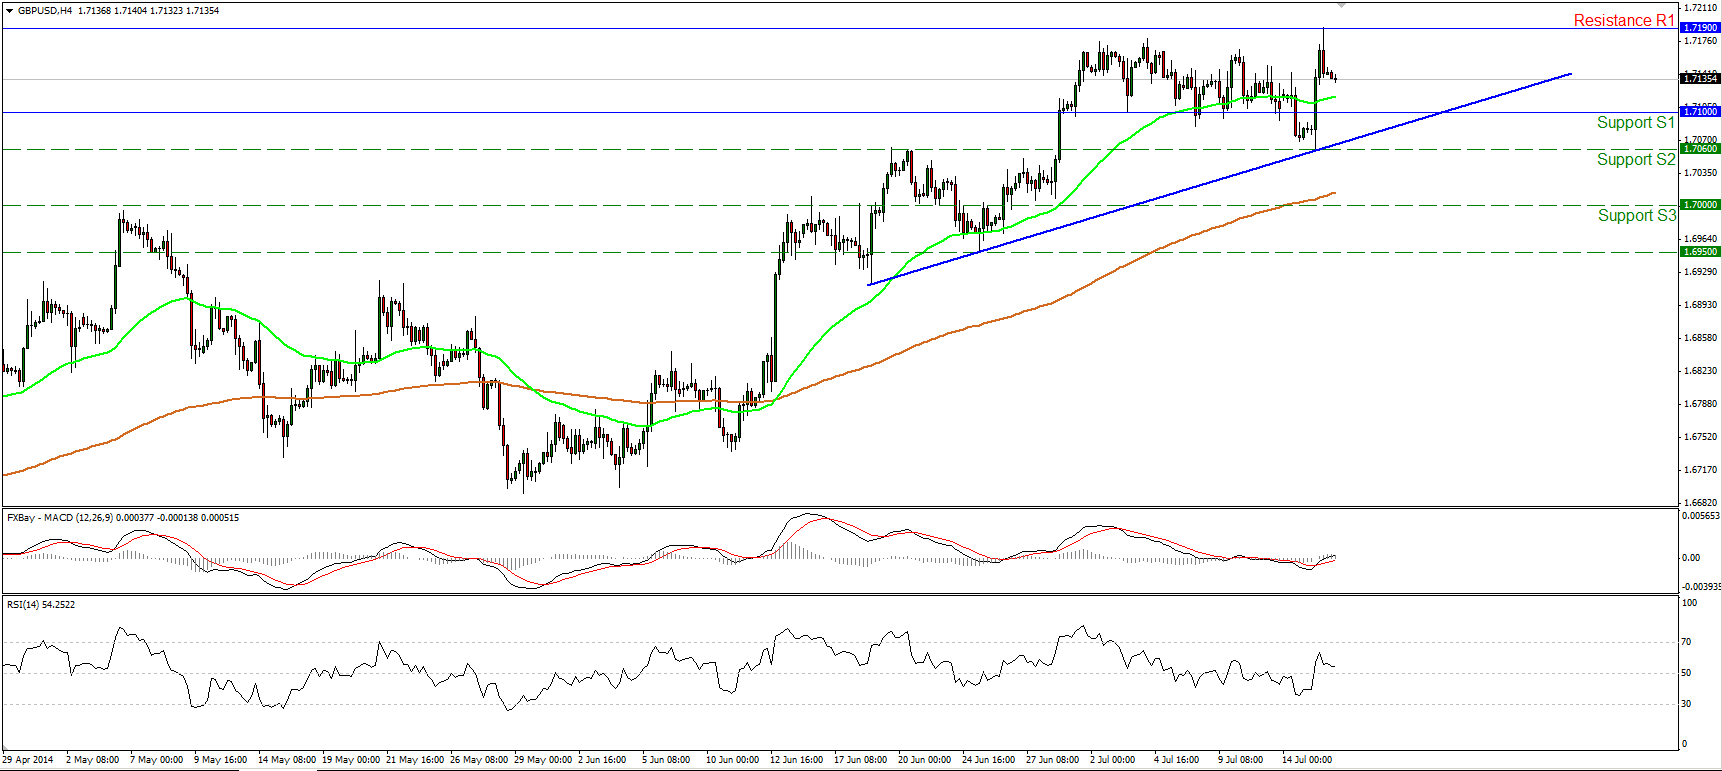
GBP/USD surges after surprising CPI data
The GBP/USD rebounded strongly from our support zone of 1.7060 (S2), moved back above 1.7100 (S1) and surged to find resistance at 1.7190 (R1). The MACD poked its nose above both its zero and trigger lines, but the RSI turned down after crossing above its 50-level. On the 1-hour chart, both our momentum studies are declining, indicating decelerating momentum after the strong rally. Considering our momentum indications, the short-term picture is cautiously positive, in my view, and a decisive move above 1.7190 (R1) could signal another higher peak and is likely to pave the way towards the 1.7300 (R2) zone. On the daily chart, the 80-day exponential moving average provides reliable support to the lows of the price action, keeping the long-term path to the upside.
• Support: 1.7100 (S1), 1.7060 (S2), 1.7000 (S3).
• Resistance: 1.7190 (R1), 1.7300 (R2), 1.7400 (R3).
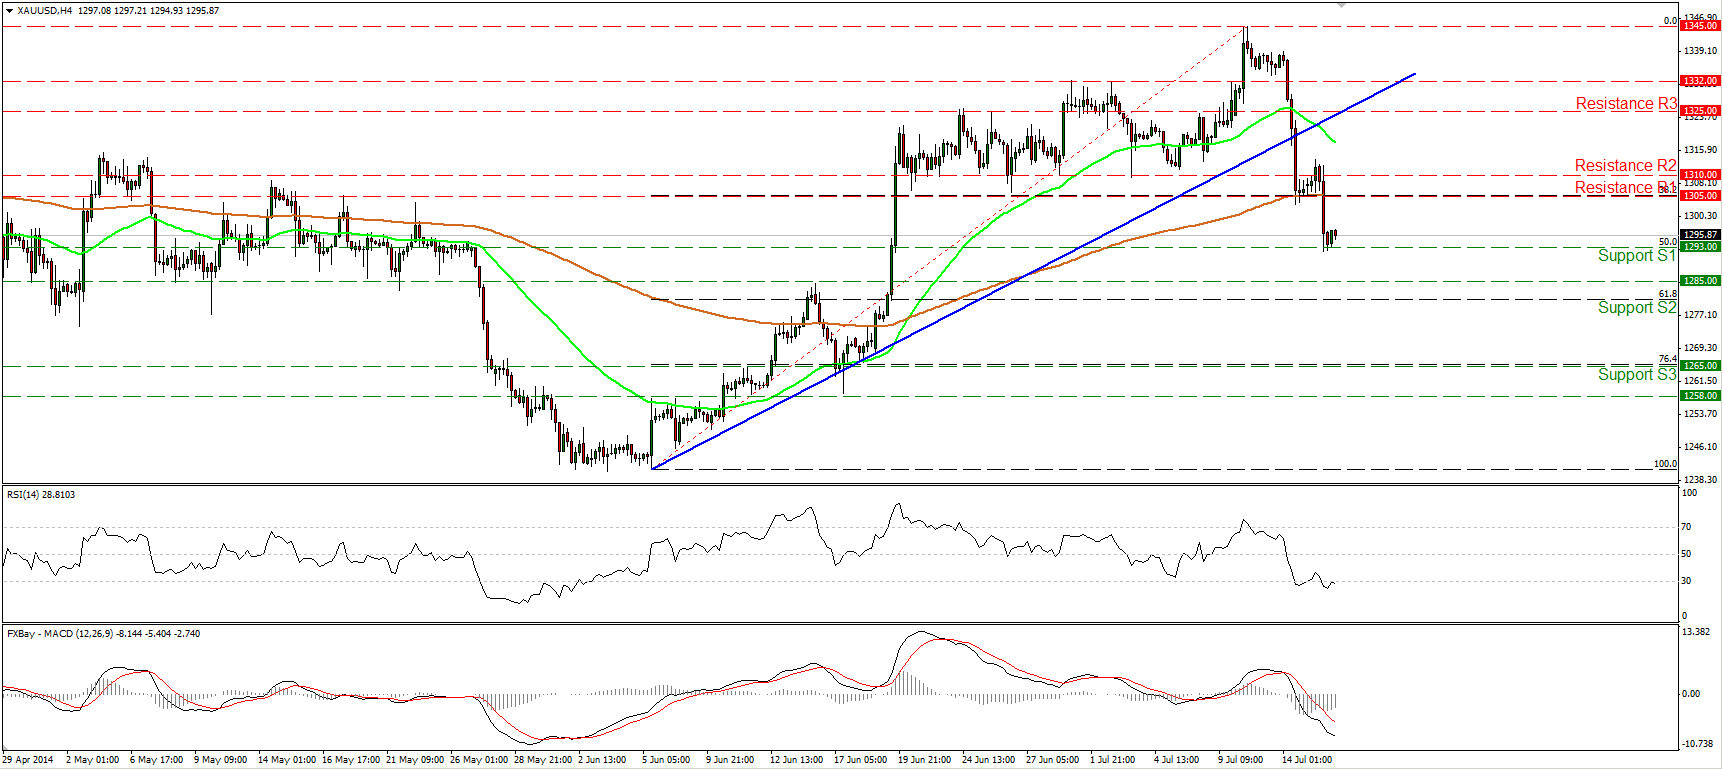
Gold bears prevail after a brief pause
Gold continued tumbling, after a small bounce from the 1305 barrier and the 200-period moving average, also the 38.2% retracement level of the 5th June – 10th of July advance. The precious metal dipped below that support (turned into resistance) zone to find support at 1293 (S1), the 50% retracement level of the aforementioned advance. The picture remains negative in my view and a clear move below 1293 (S1) could target the next obstacle at 1285 (S2). The RSI, already within its oversold zone, touched its 30 level and turned down again, while the MACD remains below both its zero and trigger lines. This confirms yesterday’s negative momentum. Nevertheless, zooming in on the 1-hour chart, I see positive divergence between our hourly momentum studies and the price action, and as a result I cannot rule out another pause near 1293 (S1) before the bears take control again.
• Support: 1293 (S1), 1285 (S2), 1265 (S3).
• Resistance: 1305 (R1), 1310 (R2), 1325 (R3).
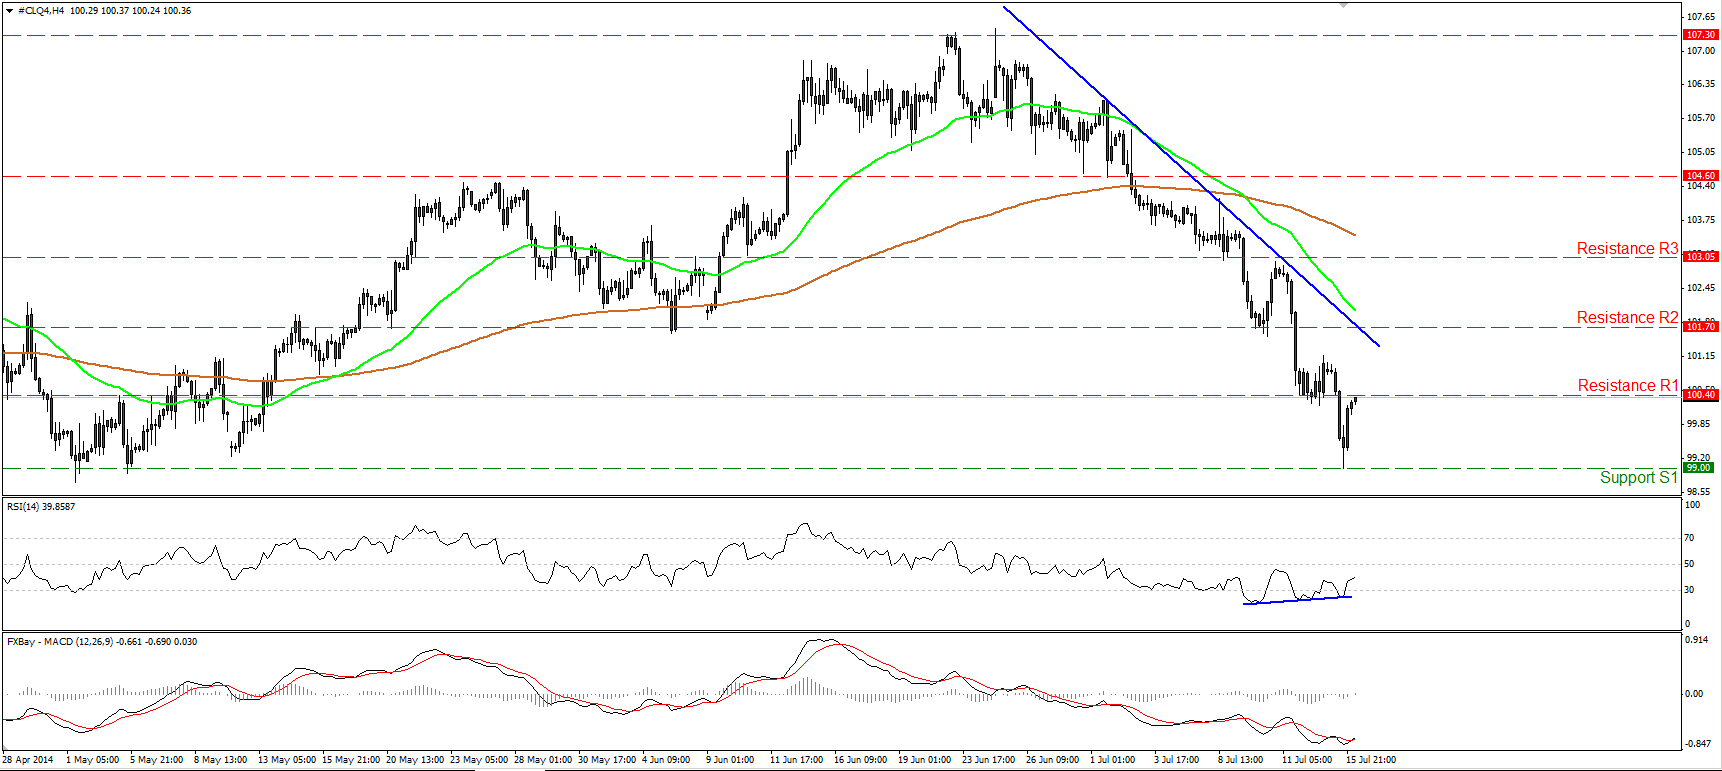
WTI dips below 100.40, but rebounds from 99.00
WTI fell sharply yesterday, breaking below the 100.40 zone and reaching the support barrier of 99.00 (S1), where it triggered some buy orders and rebounded strongly. Although the move confirmed a lower low and kept the downtrend in motion, the positive divergence between the RSI and the price action is still in effect, while the MACD, although in its negative field, crossed above its signal line. Bearing that in mind, I would remain flat for today, since the upside corrective wave may continue, and I would wait for a dip below 99.00 (S1) before expecting further declines.
• Support: 99.00 (S1), 98.00 (S2), 97.00 (S3).
• Resistance: 100.40 (R1), 101.70 (R2), 103.05 (R3).

