Among the more popular portfolios on Scott’s Investments has been the ETFReplay.com Portfolio. The strategy has been revised and improved for 2013 in order to make it simpler to follow.
I previously detailed here and here how an investor can use ETFReplay.com to screen for best performing ETFs based on momentum and volatility. I select only the top 4 ETFs out of a static basket of ETFs and re-balance the portfolio monthly. Previously, the static basket of ETFs was 25. This number of ETFs creates a high degree of turnover and also creates cross-over among ETFs that have a high correlations. For example, if you are only purchasing 4 ETFs each month and 2 or 3 of the ETFs are highly correlated, there is little benefit in holding more than 1 of the ETFs.
For 2013 the static basket of ETFs was reduced to 15. From this basket of 15, the top 4 will be selected each month. The portfolio will be re-balanced at the beginning of each month. When a holding drops out of the top 5 ETFs it will be sold and replaced with the next highest ranked ETF. I added the top 5 requirement in order to further limit turnover. ETFs will be ranked on a combination of their 6 month returns, 3 month returns, and 3 month volatility (lower volatility receives a higher ranking).
In addition, ETFs must be ranked above the cash ETF SHY in order to be included in the portfolio, similar to the absolute momentum strategy I profiled here. This modification could help reduce drawdowns during periods of high volatility and/or negative market conditions (see 2008-2009).
The top 5 ranked ETFs as of 4/30/13 are below:
VNQ – Vanguard MSCI U.S. REIT
RWX – SPDR DJ International Real Estate
HYG – iShares iBoxx High-Yield Corp Bond
VTI – Vanguard MSCI Total U.S. Stock Market
LQD – iShares iBoxx Invest Grade Bond
For May there are no transactions, which is typically a good sign month to month. Current positions maintaining strength tend to equate to higher returns and lower transaction fees.
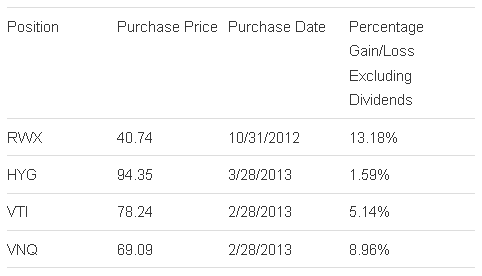
The four current positions are below:
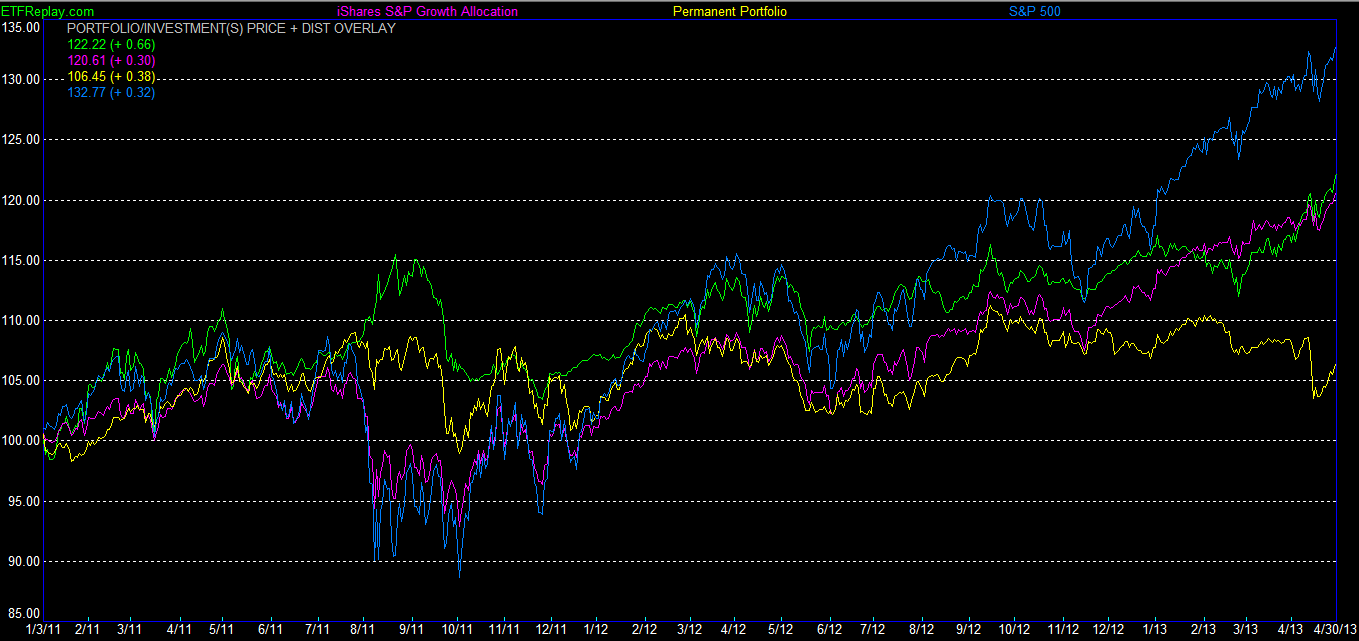
The portfolio is up over 22% since inception, which currently lags the S&P 500 (via the SPY ETF) on a nominal return basis. However, you can see the potential benefit during periods of equity pullbacks (of which we have had very few the past couple of years!) when the portfolio outperformed in 2011. It has also slightly outpaced a 60/40 balanced ETF and the Permanent Portfolio:
Disclaimer: Stock Loon LLC, Scott's Investments and its author is not a financial adviser. Stock Loon LLC, Scott's Investments and its author does not offer recommendations or personal investment advice to any specific person for any particular purpose. Please consult your own investment adviser and do your own due diligence before making any investment decisions.
- English (UK)
- English (India)
- English (Canada)
- English (Australia)
- English (South Africa)
- English (Philippines)
- English (Nigeria)
- Deutsch
- Español (España)
- Español (México)
- Français
- Italiano
- Nederlands
- Português (Portugal)
- Polski
- Português (Brasil)
- Русский
- Türkçe
- العربية
- Ελληνικά
- Svenska
- Suomi
- עברית
- 日本語
- 한국어
- 简体中文
- 繁體中文
- Bahasa Indonesia
- Bahasa Melayu
- ไทย
- Tiếng Việt
- हिंदी
ETF Replay Portfolio For May
Published 05/01/2013, 06:08 AM
Updated 07/09/2023, 06:31 AM
ETF Replay Portfolio For May
3rd party Ad. Not an offer or recommendation by Investing.com. See disclosure here or
remove ads
.
Latest comments
Install Our App
Risk Disclosure: Trading in financial instruments and/or cryptocurrencies involves high risks including the risk of losing some, or all, of your investment amount, and may not be suitable for all investors. Prices of cryptocurrencies are extremely volatile and may be affected by external factors such as financial, regulatory or political events. Trading on margin increases the financial risks.
Before deciding to trade in financial instrument or cryptocurrencies you should be fully informed of the risks and costs associated with trading the financial markets, carefully consider your investment objectives, level of experience, and risk appetite, and seek professional advice where needed.
Fusion Media would like to remind you that the data contained in this website is not necessarily real-time nor accurate. The data and prices on the website are not necessarily provided by any market or exchange, but may be provided by market makers, and so prices may not be accurate and may differ from the actual price at any given market, meaning prices are indicative and not appropriate for trading purposes. Fusion Media and any provider of the data contained in this website will not accept liability for any loss or damage as a result of your trading, or your reliance on the information contained within this website.
It is prohibited to use, store, reproduce, display, modify, transmit or distribute the data contained in this website without the explicit prior written permission of Fusion Media and/or the data provider. All intellectual property rights are reserved by the providers and/or the exchange providing the data contained in this website.
Fusion Media may be compensated by the advertisers that appear on the website, based on your interaction with the advertisements or advertisers.
© 2007-2024 - Fusion Media Limited. All Rights Reserved.
