Management has reiterated FY19 guidance, despite revenue growth at the interim stage being a little below its own expectations. H219 should provide better revenue and profit growth as new modules will stimulate growth, and the internal investment reduces. Our underlying forecasts are unchanged, but we have downgraded revenue and EBITDA forecasts for FY19 and FY20 to take account of the disposal of ARIVA. EQS continues to trade at a significant discount to its peers, and the current share price is discounting growth well below management’s expectations.
Accelerating growth in Compliance
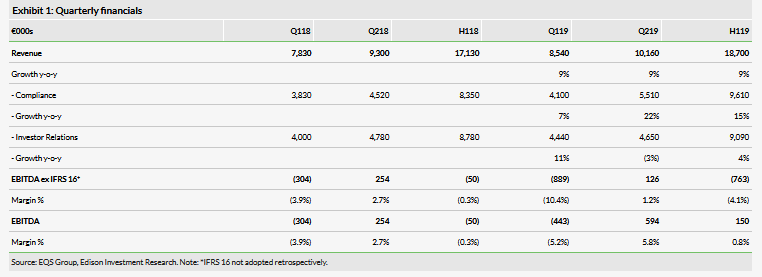
The Q219 results continued to highlight the differential growth rates between the two business segments, albeit there were phasing issues in both. The Compliance segment grew revenue by c 22% year-on-year and Investor Relations declined by c 3% y-o-y. Despite the acceleration by Compliance in Q219, overall revenue growth was a little below management’s expectations. The key reasons for this were delays to module launches in the new COCKPIT products, which will correct in H219, and some phasing issues. As a result, guidance for revenue and EBITDA in FY19 is unchanged.
Improving outlook for margin
Eqs Group AG (DE:EQSn) should be entering a phase of more positive news flow with revenue growth expected to exceed cost growth and sequential improvements in EBITDA. Revenue growth should be driven by the migration of the customer base as all modules become available over the next few months. Cost growth will be more favourable as the investment to build a global regulatory tech platform business reduces through FY19 and FY20.
Valuation: Supported by peers and DCF
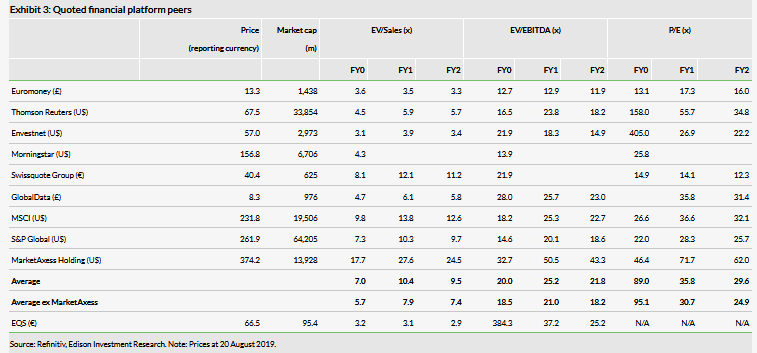
As the current level of investment in the group is affecting profitability, the only reliable valuation with which to compare EQS vs its peers is EV/Sales. The peer group of other global financial platforms (excluding outliers) is valued at 5.7x FY0 and 7.9x FY1 against EQS, which is valued at 3.2x and 3.1x, a discount of 44% and 61% respectively. A reverse DCF suggests that the current share price is discounting revenue CAGR of 17% and EBITDA margin of 20% after our explicit forecast period FY19–20. These are lower than management’s targets of 18–20% revenue growth and an EBITDA margin of at least 30% by FY25.
Review of Q219 results
Overall revenue growth of c 9% in Q219 was the same as the growth rate in Q119, although the performance by business segment was markedly different. The Compliance segment accelerated after a relatively lacklustre Q119, but trends in Investor Relations deteriorated. The performance was a little below management’s own expectations, which it attributes to delays in product launches, some changes in seasonality and some macro weakness. Management is confident of an acceleration in H219, and specifically Q419, when customers are migrated over to new products following a period of heavy investment.
The most important feature of the results was the improvement in profitability as investment in Cloud 2020 peaked in FY18 and will reduce through FY19 and FY20. Management is confident of improving the underlying margin on a quarterly basis, subject to the normal seasonality in the individual businesses, due to the combination of expected revenue growth and reducing investment.
Net debt at the end of H119 increased to €21.6m from €10.4m at the end of FY18, mainly attributable to the adoption of IFRS 16, which added €9.4m to net debt. There was a small cash outflow of €68k in FY19, a significant improvement on the cash performance in H118, due to less M&A activity, a reduction in capex as expected and good control of working capital.

Even though revenue growth for Compliance accelerated from Q119, from 7% to 22%, the achieved growth was below management’s own expectations. The core Large Caps business continued to demonstrate strong growth of over 24% due to an 18% increase in customer numbers and the ongoing take-up of recent module launches. The main sources of relative weakness were in the XML business, with some modest recovery in Q219, as indicated by management at the Q119 results. Management continues to expect improving momentum through the year to deliver a better, ie double-digit, revenue growth by XML.
The Q219 revenue decline for Investor Relations was due to delays in the launch of a couple of modules in the new COCKPIT, ie the CRM and mailing functions, as functionality was finessed and technical problems were fixed. The majority of German clients will be migrated over from September 2019, which should earn higher revenue per customer as well as installation fees.
During H119, EQS added 166 large-cap customers, which means it is on course to achieve the target for the full year of adding 400 large-cap customers, given the typical Q4 seasonality.
Geographically, the domestic business grew by 6% and was the main source of relative disappointment, but this is attributable to the COCKPIT and filings delays noted above. As a result, management is more optimism about growth in H219 as these improve. International markets were buoyant with 20% growth. This growth was broadly based with the only area of weakness being Asia.
Forecasts: Updated from disposal
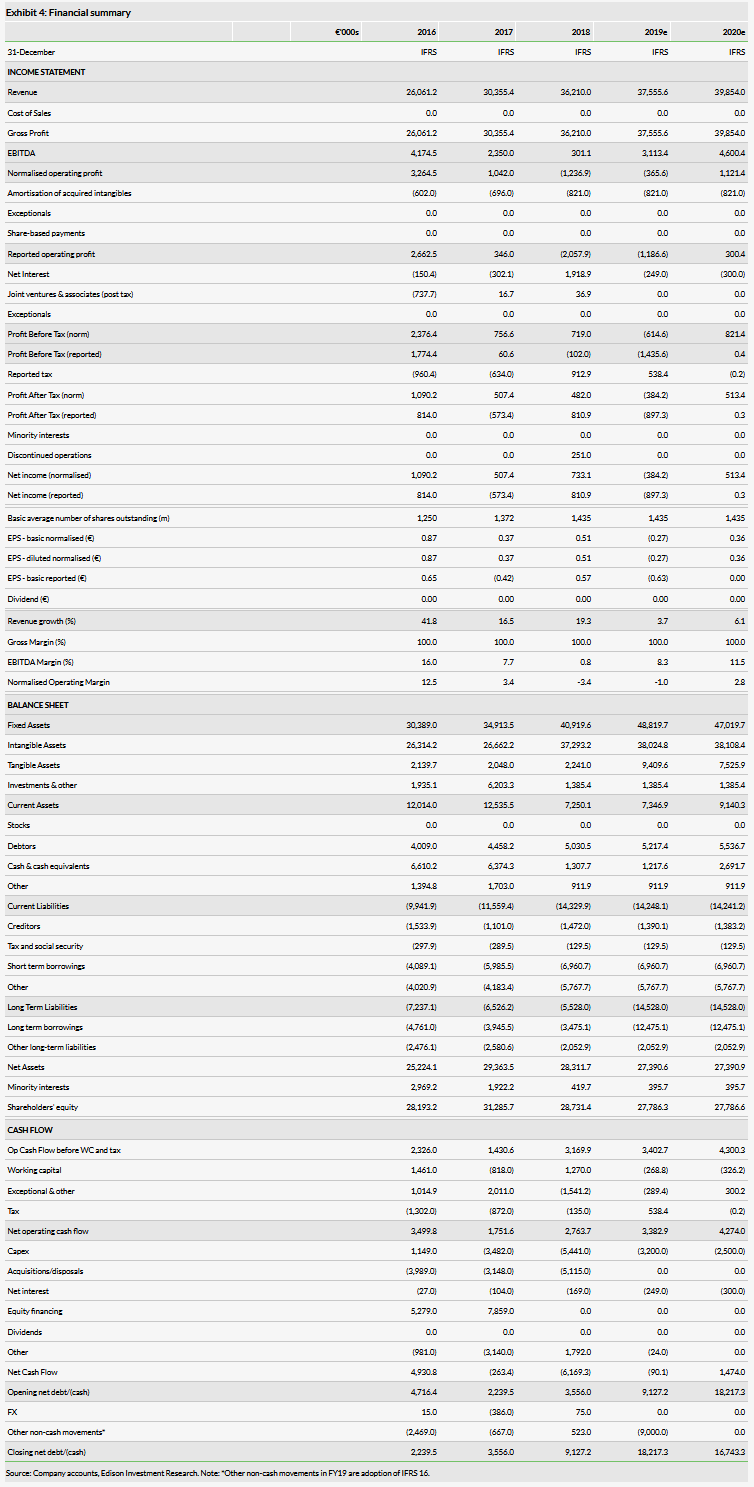
We update our forecasts to take account of the sale of ARIVA, which is effective from 1 July 2019. ARIVA contributed €3.5m revenue in H119, an increase of c 5% versus H118, and it contributed €7.4m of revenue in FY18.

Our EBITDA forecast for FY19 of €3.1m compares with management’s guidance of €2.8–3.8m. There is no formal guidance for FY20, but we believe the aspiration is to achieve an EBITDA margin of c 10% versus our estimate of 8.3% for FY19 and the 0.8% achieved in H119.
Guidance for long-term profitability increased
Management has reiterated FY19 guidance. Following the disposal of ARIVA, management targets an increase in revenue of 4–9% to €37.5–39.5m (€36.2m in FY18), and EBITDA of €2.8–3.8m (IFRS 16 adjusted of €1–2m). The guidance implies revenue growth for the non-ARIVA businesses of 18–25% in FY19.
With respect to long-term guidance, management has reduced the target for revenue and increased the target for EBITDA margin in FY25. The new guidance reflects the disposal of ARIVA, which has a lower projected margin than the remaining businesses. From FY19–25 management targets annual revenue growth of 20%+ for Compliance (20–25% previously) and 10%+ for Investor Relations (10–15% previously), to give a CAGR for the group of 18–20%, and revenue in FY25 of c €100m (c €110m previously). On the plus side, management expects profitability to increase at a faster rate than revenue over this period. It targets an EBITDA margin of at least 30% in FY25, compared to at least 25% previously. This guidance points to a higher level of EBITDA in FY25, ie greater than €30m versus greater than €27.5m previously.
Valuation
A reverse DCF, using a WACC of 8% and terminal growth rate of 2% beyond 2025 suggests that the current share price is discounting a CAGR for revenue from FY21–25 of 17% and an EBITDA margin of 20% throughout this period. The revenue growth rate is at the low end of management’s expectations and the EBITDA margin of 20% is significantly below the 30% expected by FY25. If we assume revenue growth of 20% (the top end of management’s target) and that the EBITDA margin gradually increases to 30% by FY25, the DCF value would increase to c €120.

As the internal investment is affecting profitability from FY18–20, the most reliable traditional multiple is that of EV/Sales. There is a wide range of multiples for the peer group. For FY1, EQS is trading at 3.1x sales versus the average for the entire peer group pf 10.4x. Excluding MarketAxess, which is trading at a high premium to the rest of the peers, the average sales multiple for the peer group is 7.9x.
