Monthly S&P500 Emini futures candlestick chart:
Inside bar after sharp pullback

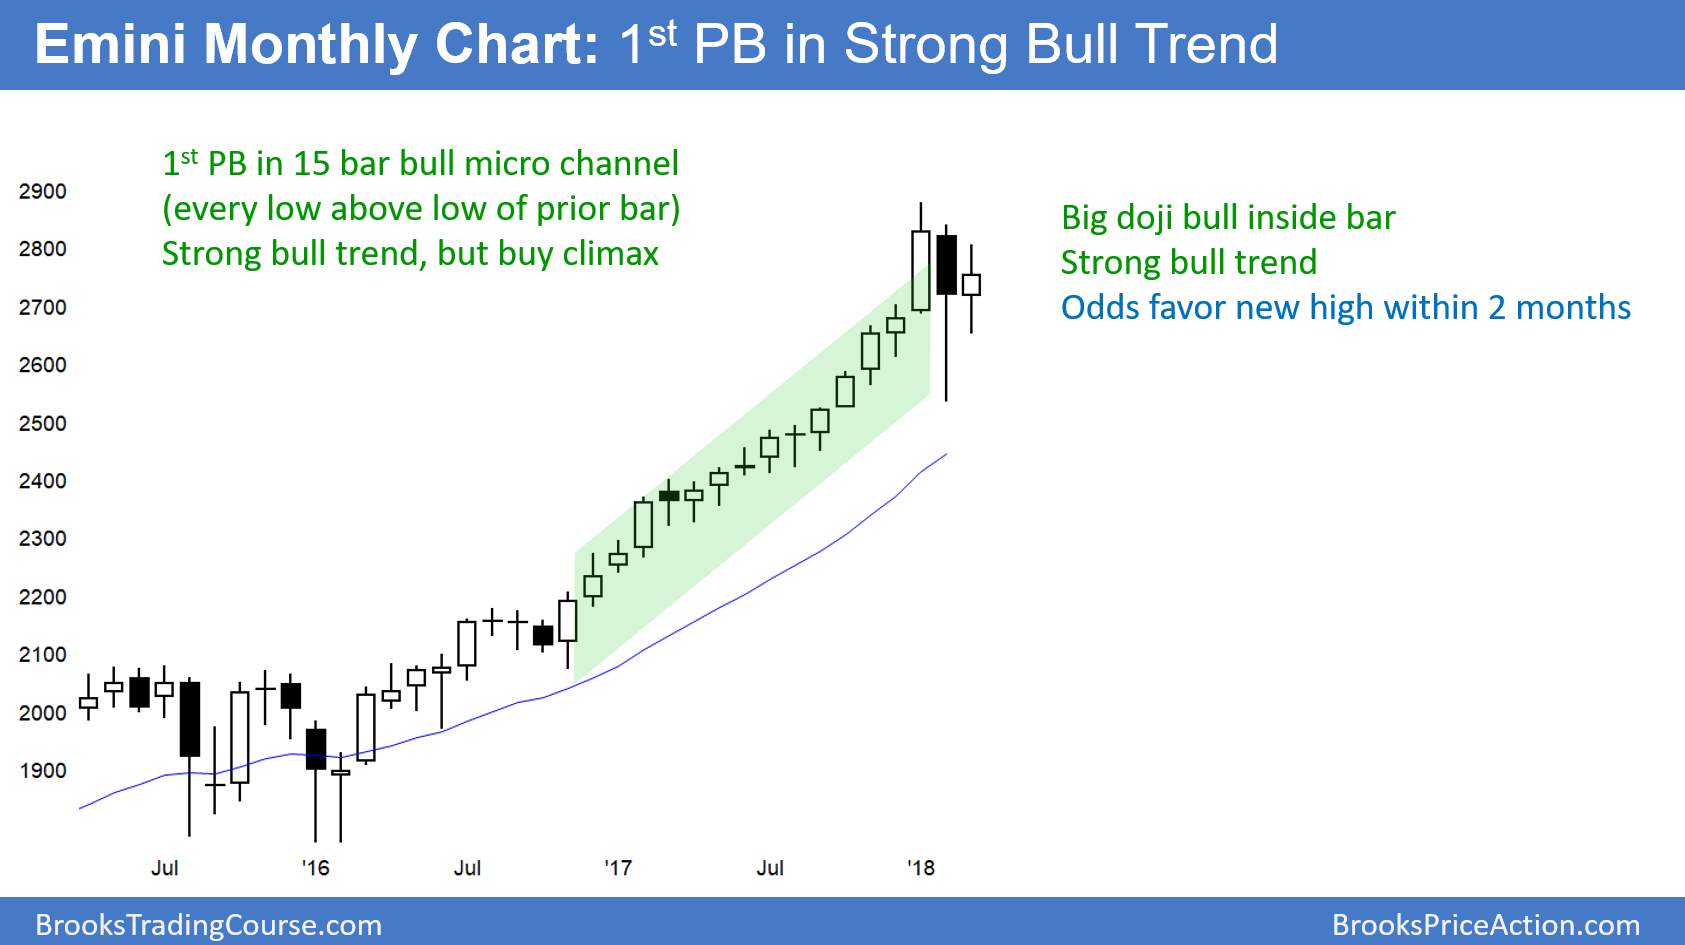
The March bar on the monthly S&P500 Emini futures candlestick chart has a high below the February high and a low above the February low. It is therefore so far a small inside bar.
The monthly S&P500 Emini futures candlestick chart has an inside bar so far for March. It is far from last month’s high and low. Therefore, it will probably end the month as an inside bar. The open of the month is in the middle of the range, and in the middle of February’s range. After last month’s big selloff and January’s big rally, traders are uncertain. Uncertainty usually leads to a trading range.
The Emini might end the month as neutral as possible. If it closes at the open, it will be a doji inside bar in the middle of February’s range. That would be the maximally neutral appearance for the month.
An inside bar is both a buy signal and a sell signal
The bulls would like the month to close near its high. An inside bar in a bull trend is a buy signal bar. It will have a higher probability of leading to a rally if it closes near its high.
The bears want the month to close near its low. It would therefore be a bear inside bar. Even though February was a climactic reversal down, it was a minor reversal. Therefore, even if March closes on its low, it would be a minor sell signal. After 15 months without a pullback, this 2 month pullback will probably last 3 – 4 months. The bull trend should then test the January high.
Weekly S&P500 Emini futures candlestick chart:
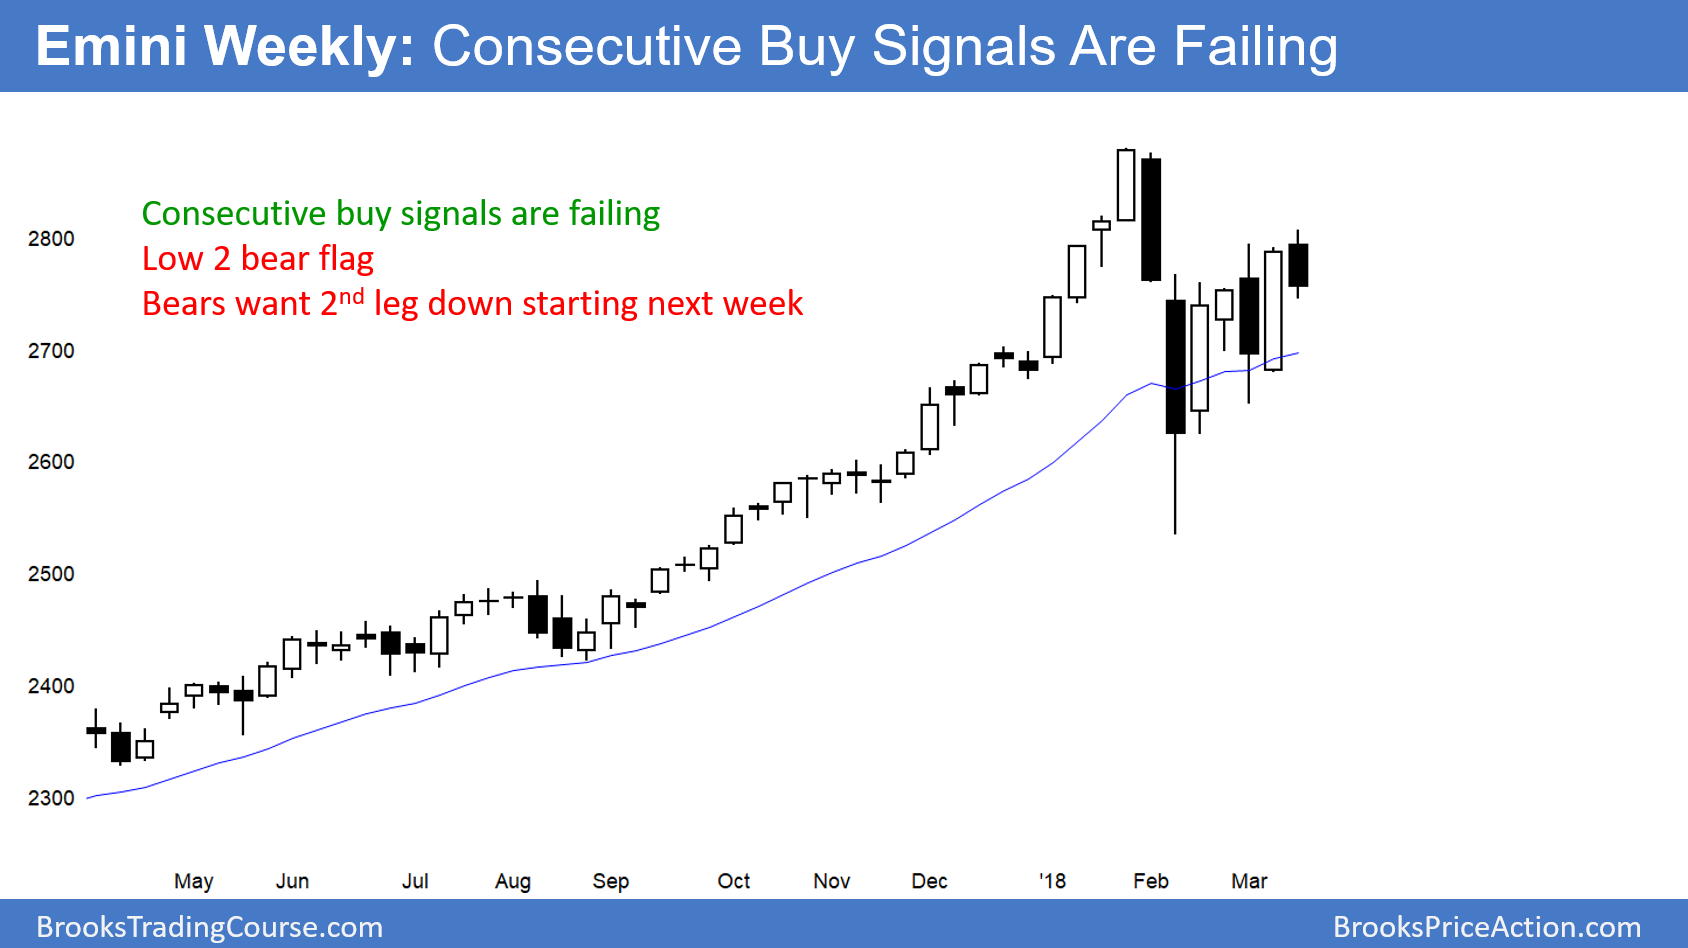
Low 2 bear flag.

The weekly S&P500 Emini futures candlestick chart had a bull inside bar last week, which was a buy signal. Three weeks earlier, there were consecutive bull inside bars, which was also a buy signal. Both buy signals triggered, but the Emini immediately reversed down after breaking above the bull inside bars.
While the bulls are still long from both buy signals, the signals are likely to fail. Most bulls will exit next week below this week’s low or below the low of the ii from 3 and 4 weeks ago. This is because when the Emini tries to do something twice and fails, it usually then tries to do the opposite. Consequently, if next week trades below this week’s low or below the ii, it would trigger a sell signal.
Since the weekly chart is still in a bull trend, any sell signal is minor. This makes a bear trend unlikely. However, it could lead to a test of the low of the ii from 4 weeks ago. Less likely, the selloff could test the February low. Any reversal down next week would extend the trading range for several more weeks.
Daily S&P500 Emini futures candlestick chart:
Emini double top pullback after tariff threats and Congressional defeat

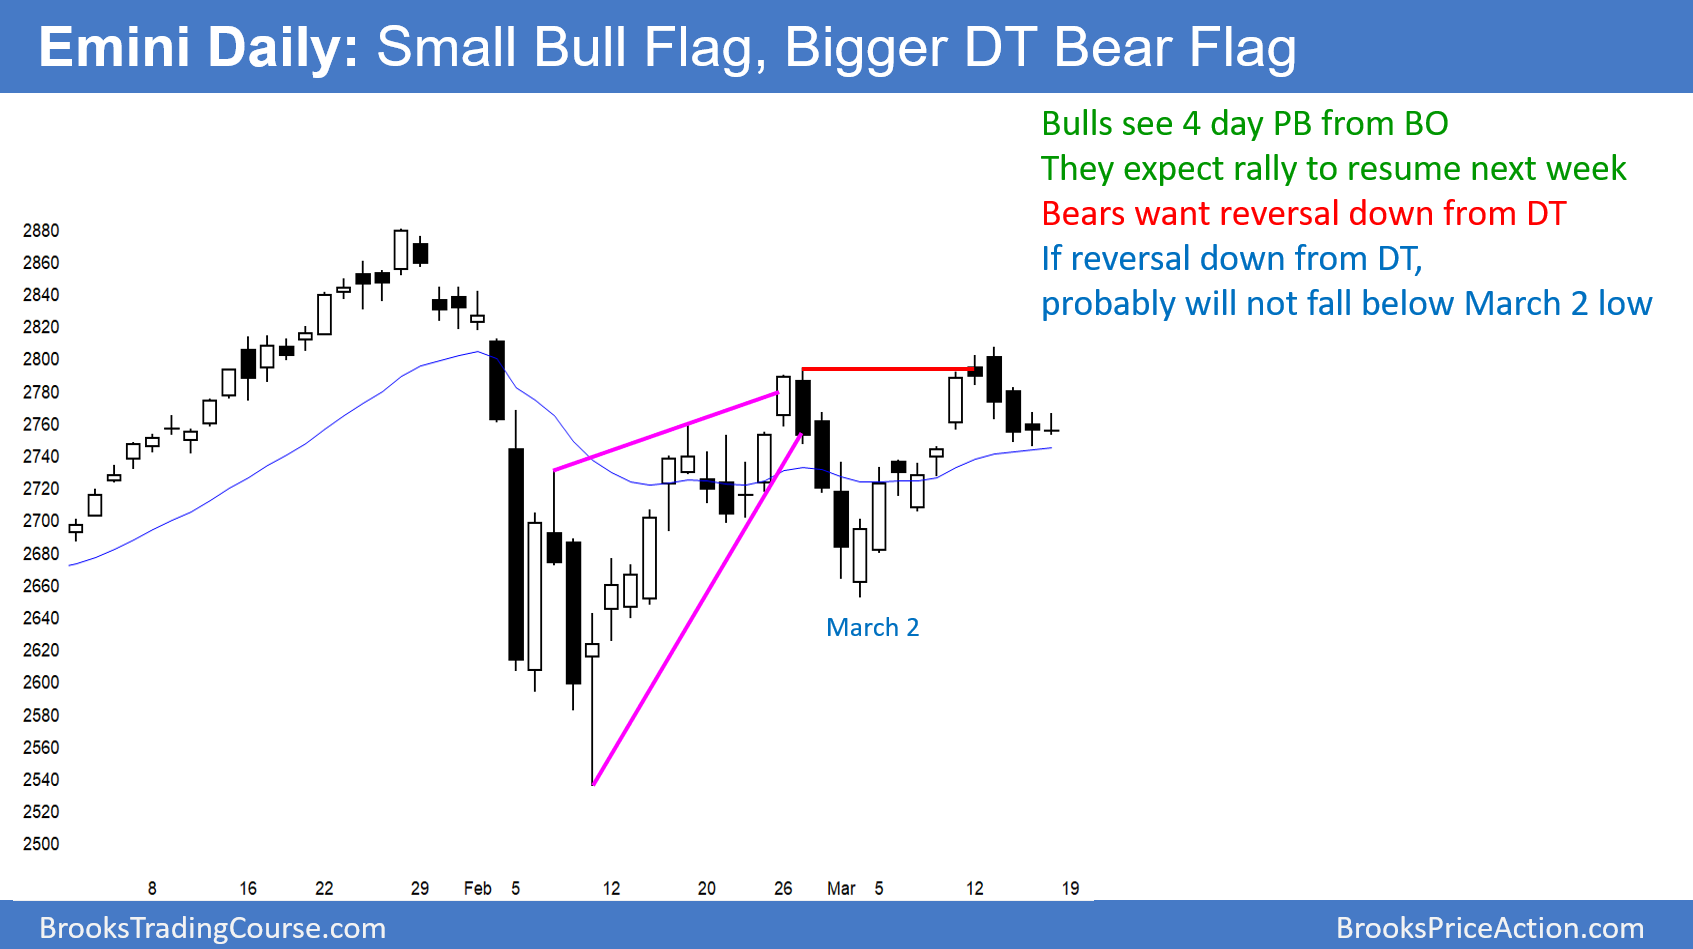
The daily S&P500 Emini futures candlestick chart broke above the February 27 major lower high, but immediately reversed down. Traders are deciding if the reversal will lead to a test of the March 2 low or if it is just a pullback that will lead to a new all-time high.
The daily S&P500 Emini futures candlestick chart is reversing down from above the February 27 high. This is in part due to Trump’s tariff threats and this week’s loss of a republican congressional seat. The bears see this week’s high as forming a double top with the February 27 high.
Since the double top is following a strong reversal down in early February, it is a double top major trend reversal. A strong major trend reversal has only a 40% chance of leading to a reversal into a bear trend. Because the 2 reversals up in February were extremely strong, this major trend reversal has only a 30% chance of being the start of a bear trend.
More likely, it is a minor reversal in a 2 month trading range. While the trading range can continue indefinitely, it will probably end with a bull breakout within a couple of months. This is because the monthly bull trend is so strong.
Bear trend unlikely
The bears want this week’s selloff to be the start of a move down to the March 2 low and then the February low. There is only a 30% chance of a strong break below the February low. However, there is a 50% chance of a test down to the March 2 low before a test of the all-time high.
If the bears succeed in testing the March 2 major higher low, the odds are that the bulls will get a reversal back up from there. That would be a double bottom bull flag. If the rally is strong, the odds would favor a test of the January all-time high.
Wednesday’s FOMC announcement
The Emini will probably be sideways going into Wednesday’s 11 a.m. FOMC announcement. There will probably not be a surprise. However, an FOMC meeting always has an increased chance leading to a big move up or down. Furthermore, the breakout can be strong enough to have follow-through for a couple of weeks.
March and April are seasonally bullish
Calendar tendencies are always minor. Traders should never place trades based on them because it is a losing strategy. However, March and April are the 2 consecutive months with the highest average return. Therefore, there is a slight bullish bias through April.
Far more important is the 15 bar bull micro channel on the monthly chart. The odds are that the 1st pullback will last only 1 – 3 months. March is the 2nd month. Consequently, no matter what happens after the FOMC announcement, the odds are that the Emini will test its old high by the end of April.
