Cobalt International Energy, Inc. is an independent, oil-focused exploration and production company with a salt prospect inventory in the deepwater of the United States Gulf of Mexico and offshore Angola and Gabon in West Africa.
This is an elevated vol note in a stock that has earnings approaching. It's obviously not curious why vol is elevated, but rather, how much it's elevated that caught my attention.
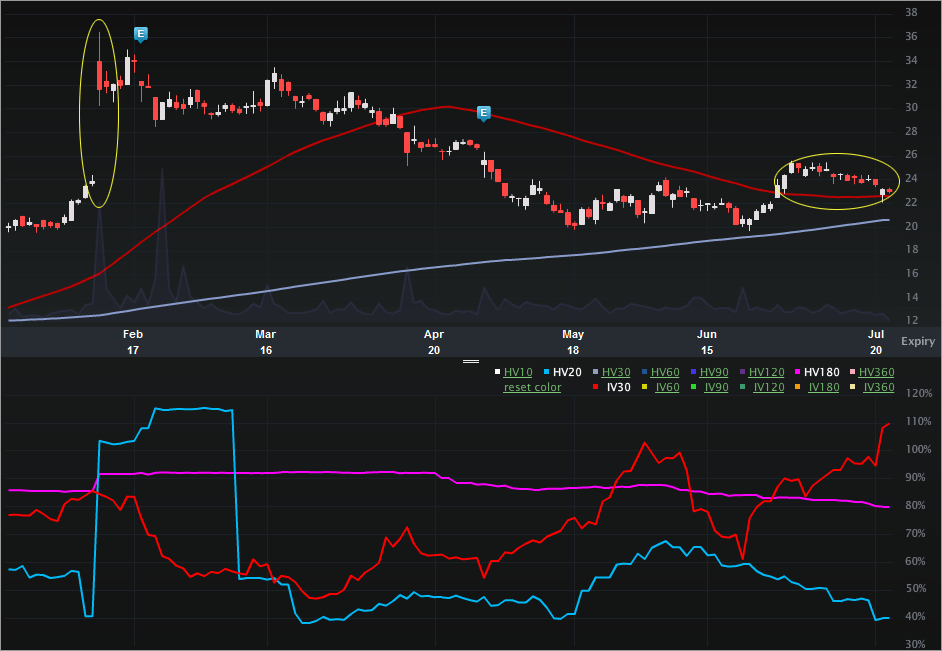
Let's start with the Charts Tab (six months), below. The top portion is the stock price, the bottom is the vol (IV30™ - red vs HV20™ - blue vs HV180™ - pink).
On the stock side we can see the gap up on 2-10-2012. The price rose from $23.90 to $31.68 or 32.6%. Here's the news behind that move:
---
NEW YORK (AP) -- Shares of oil producer Cobalt International Energy Inc. surged 36 percent Friday after the company released a study showing that one of its wells might be far more productive than many analysts thought.
THE SPARK: On Thursday, Cobalt International released the results of test drilling at the company's "Cameia-1" well off the coast of Angola. Cobalt International said the well yielded "exceptional results" and will be able to produce 20,000 barrels of oil per day.
THE BIG PICTURE: The Cameia-1 well is just the beginning of Cobalt International's efforts to drill oil off the western coast of Africa. The company said it has plans to drill even deeper wells now that Cameia-1 has proven to be so productive.
When a well proves to be surprisingly productive, it's like winning the lottery for an oil company. Firms like Cobalt International invest in drilling leases and exploratory wells without knowing how much fuel they will produce.
Source: AP via Yahoo! Finance; Cobalt International up 36 percent on well results.
The firm released earnings a couple of weeks later and fell on the results. Here's that news:
Cobalt International Energy Inc. (CIE), the deep-water oil explorer whose largest investors include Goldman Sachs Group Inc. (GS), fell the most in two months after posting a fourth-quarter loss almost twice the average estimate.
The shares declined 6.1 percent to $31.97 at the close in New York. Before today, the stock had more than doubled in the past year as Cobalt announced discoveries off the coast of Africa and in the Gulf of Mexico, including a field the company said may hold 1 billion barrels of crude.
Cobalt’s loss widened to $51.1 million, or 13 cents a share, from $29.8 million, or 9 cents, a year earlier, the Houston-based company said today in a Business Wire statement. The average of 10 analysts’ estimates compiled by Bloomberg was for a per-share loss of 7.4 cents.
Source: Bloomberg via Yahoo! Finance; Cobalt Tumbles on Bigger-Than-Expected Loss: Houston Mover, written by Joe Carroll.
---
Even with that news, we can see that the stock found a quiet period following earnings. Fast forwarding to today, we can see again that the stock is in a sort of quiet period -- it's been declining, but steadily and without any gaps.
Turning to the vol side we can see a number of phenomena:
1. The implied has been rising since 6-22-2012, from 61.21% to 109.60% or 79%. The 52 wk range in IV30™ is [46.41%, 111.52%], putting the current level in the 96th percentile.
2. As the implied has been rising, the short-term and long-term historical realized vols have been declining. In English, the stock has been less volatile of late while the options have been pricing in more vol. The next earnings date for CIE is in early Aug, so the rising vol makes sense. However, the vol hasn't been rising since 6-22-2012 solely b/c of earnings and I don't believe it's at an annual high solely b/c of earnings either. For the last seven earnings cycles the vols on the day before the news have been:
Nov 2010: 58%
Feb 2011: 51%
May 2011: 43%
Jul 2011: 55%
Nov 2011: 79%
Feb 2012: 84%
Apr 2012: 62%
Jul 2012: 109%
3. The annual high in the implied was reached outside of an earnings event as the numbers above confirm.
It's those numbers from the last several earnings reports that caught my attention when compared to the current implied. Tricky...
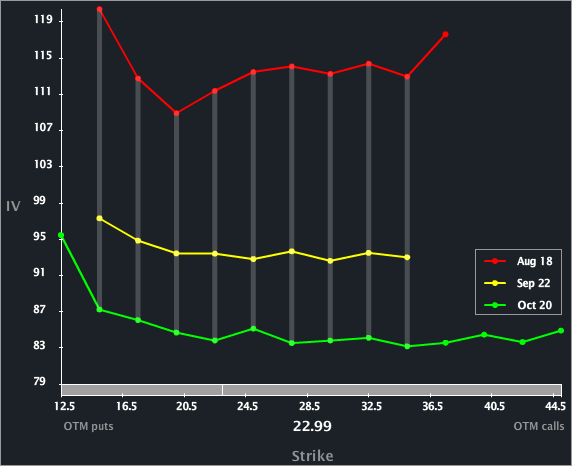
Let's turn to the Skew Tab to examine the line-by-line and month-to-month vols. 
We can see the rather substantial vol difference between the front three months. Given that earnings are approaching, the difference between the front and month 2 makes sense -- the difference between months 2 and 3 though seems a bit large. The near-term risk feels elevated beyond an earnings report.
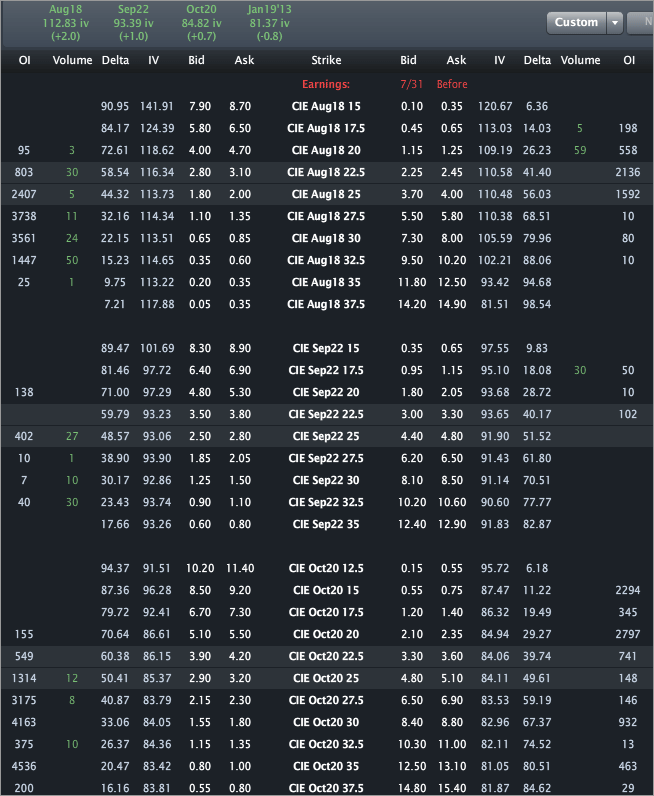
Finally, let's turn to the Options Tab, for completeness.
Across the top we can see the monthly vols are 112.83%, 93.39% and 84.82% for Aug, Sep and Oct, respectively. The earnings date listed in there is just a projection and I believe it's a touch early. In any case, something is coming for CIE, quite possibly a report on a well that could have an impact like we saw in Feb of this year (note that there is two-tailed risk, not just upside potential).
This is trade analysis, not a recommendation.
- English (UK)
- English (India)
- English (Canada)
- English (Australia)
- English (South Africa)
- English (Philippines)
- English (Nigeria)
- Deutsch
- Español (España)
- Español (México)
- Français
- Italiano
- Nederlands
- Português (Portugal)
- Polski
- Português (Brasil)
- Русский
- Türkçe
- العربية
- Ελληνικά
- Svenska
- Suomi
- עברית
- 日本語
- 한국어
- 简体中文
- 繁體中文
- Bahasa Indonesia
- Bahasa Melayu
- ไทย
- Tiếng Việt
- हिंदी
Elevated Vol May Point To Something More Than Earnings Soon
Published 07/25/2012, 03:10 AM
Updated 07/09/2023, 06:31 AM
Elevated Vol May Point To Something More Than Earnings Soon
Latest comments
Loading next article…
Install Our App
Risk Disclosure: Trading in financial instruments and/or cryptocurrencies involves high risks including the risk of losing some, or all, of your investment amount, and may not be suitable for all investors. Prices of cryptocurrencies are extremely volatile and may be affected by external factors such as financial, regulatory or political events. Trading on margin increases the financial risks.
Before deciding to trade in financial instrument or cryptocurrencies you should be fully informed of the risks and costs associated with trading the financial markets, carefully consider your investment objectives, level of experience, and risk appetite, and seek professional advice where needed.
Fusion Media would like to remind you that the data contained in this website is not necessarily real-time nor accurate. The data and prices on the website are not necessarily provided by any market or exchange, but may be provided by market makers, and so prices may not be accurate and may differ from the actual price at any given market, meaning prices are indicative and not appropriate for trading purposes. Fusion Media and any provider of the data contained in this website will not accept liability for any loss or damage as a result of your trading, or your reliance on the information contained within this website.
It is prohibited to use, store, reproduce, display, modify, transmit or distribute the data contained in this website without the explicit prior written permission of Fusion Media and/or the data provider. All intellectual property rights are reserved by the providers and/or the exchange providing the data contained in this website.
Fusion Media may be compensated by the advertisers that appear on the website, based on your interaction with the advertisements or advertisers.
© 2007-2024 - Fusion Media Limited. All Rights Reserved.
