Get 40% Off
🚨 Volatile Markets? Find Hidden Gems for Serious Outperformance
Find Stocks Now

Either Stock Are Forming A Bottom Or Heading To The Abyss

Published 02/27/2020, 03:47 AM
Updated 09/20/2023, 06:34 AM

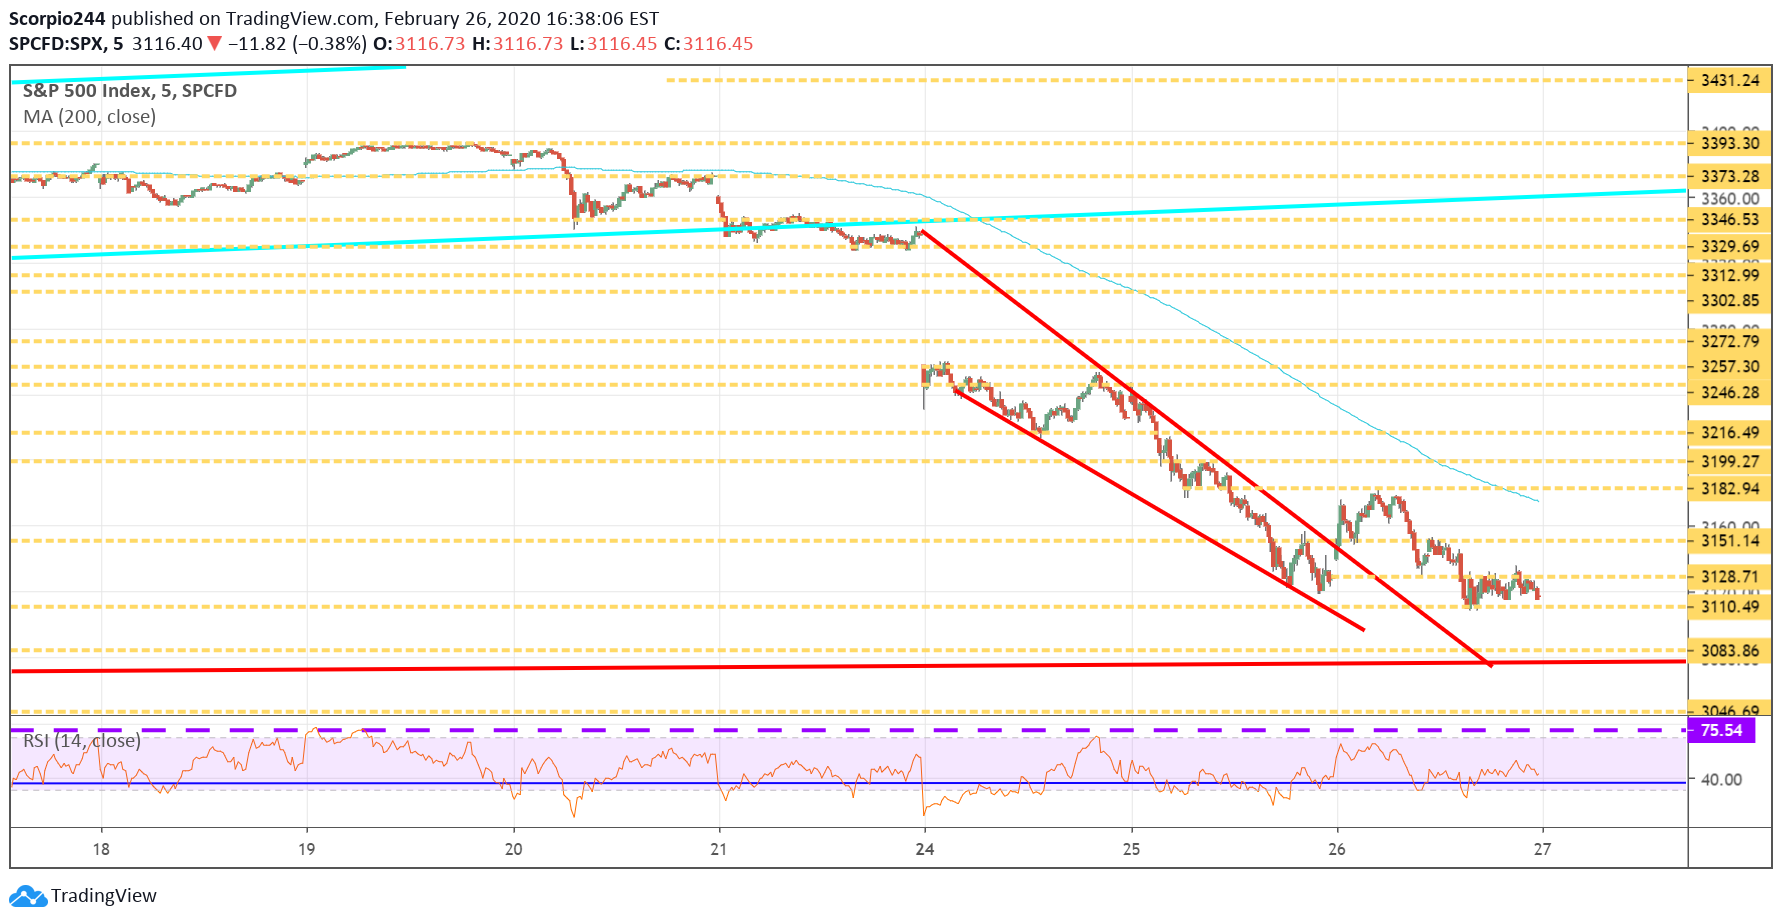
Stocks fell slightly yesterday by about 40 basis points to close at 3,116, holding support at 3,110. So did we bottom?

Again, the signs continue to suggest that we are bottoming. You want to agree with the six signs I pointed out yesterday, that’s up to you. But after a drop of 8% in a straight line, a 40 basis point drop to around Tuesday’s lows of 3,118, seems even to me.

Regardless we need to hope this is around the bottom. Otherwise, things are going to get much worse. We are at an inflection point for many important indicators, as well as the 10-year yield. So we need to see some signs of improvement and soon.
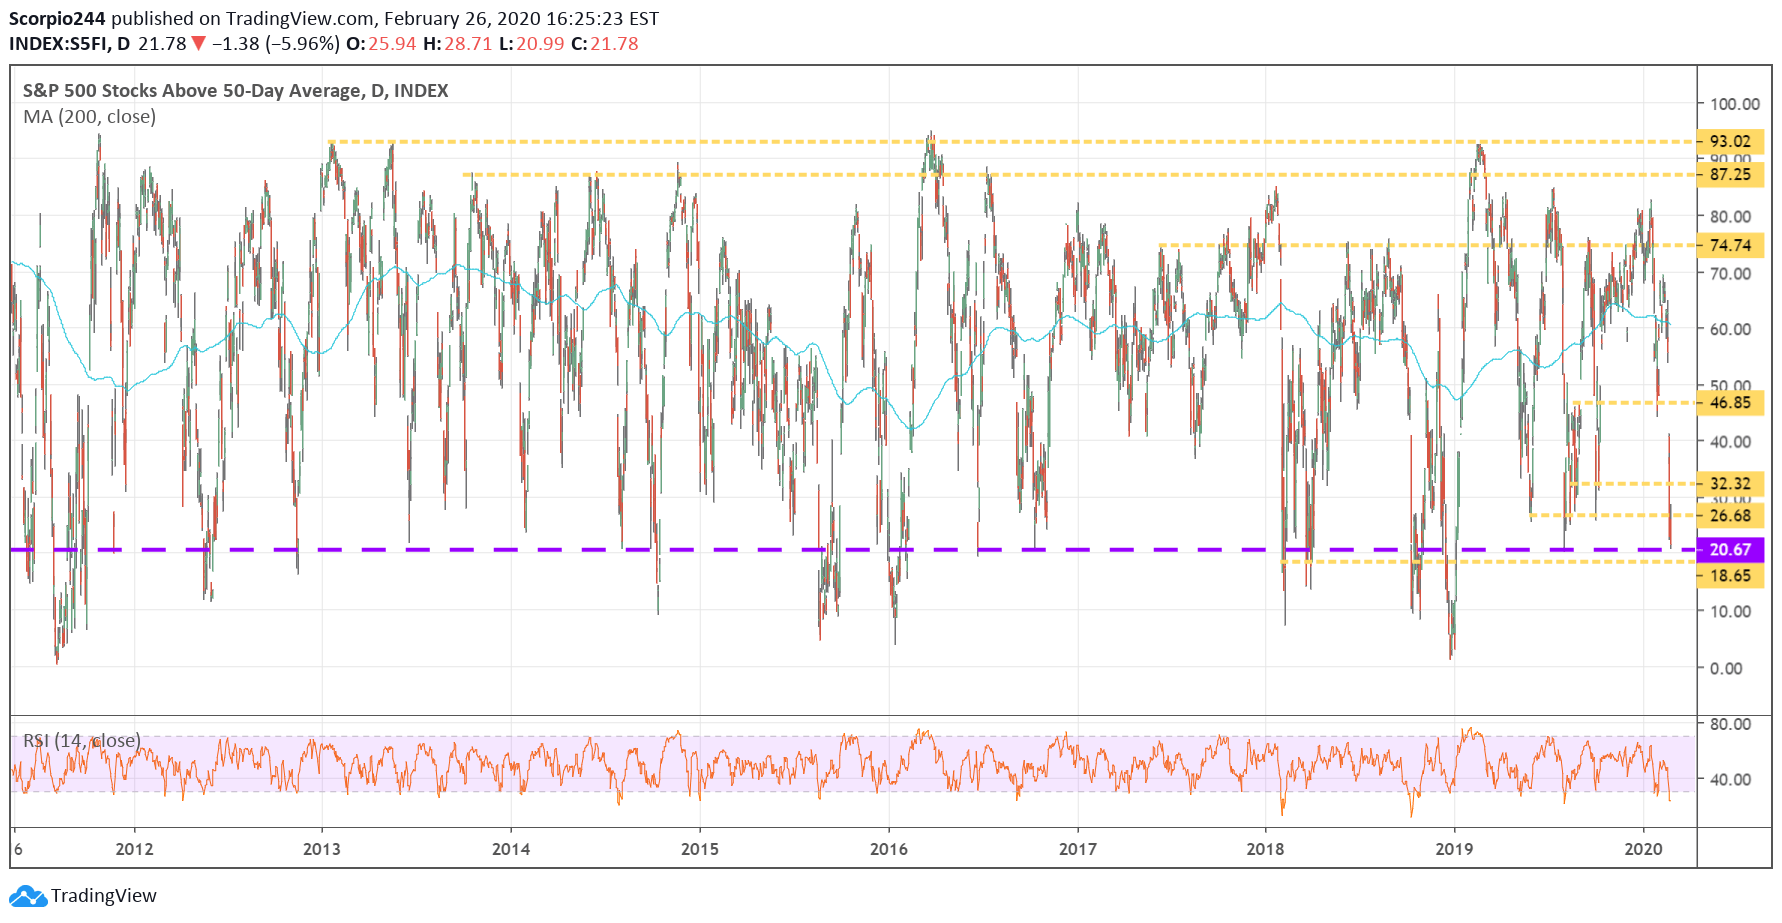
S&P 500 Index Chart

The number of stocks below their 50 and 200 day-moving average are now at the low end of the range, and there has only been a handful of other times it has gotten lower.
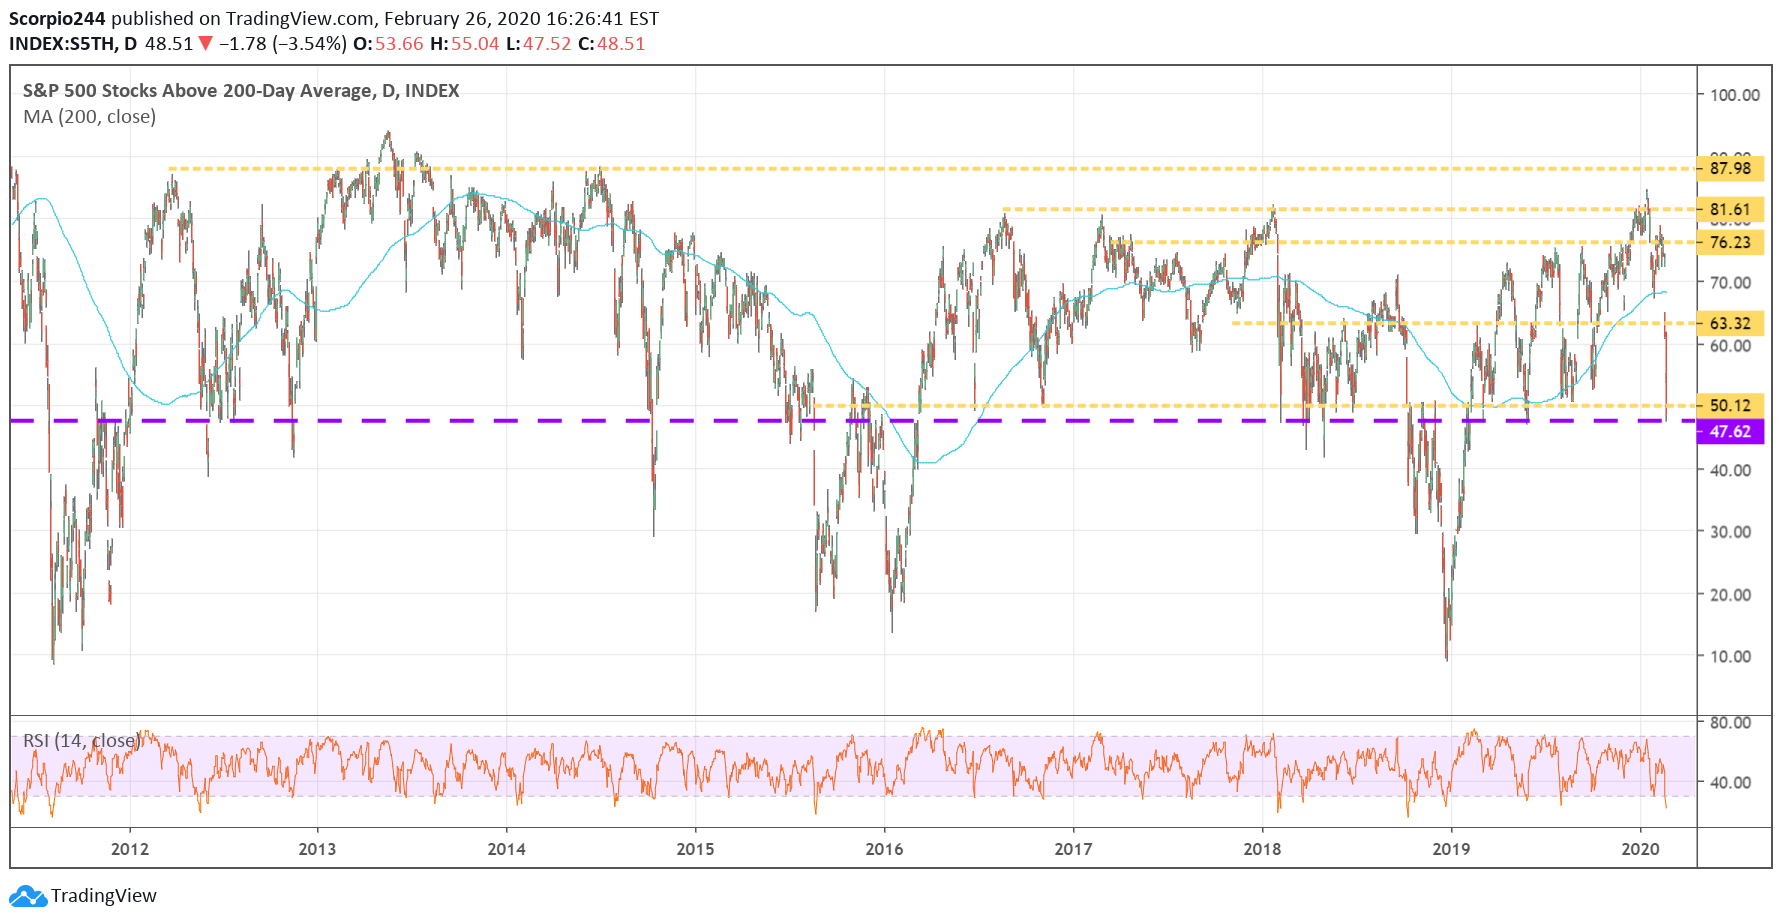
S&P 500 - Above 200 Day Average Chart

You can see in both of the charts above those ratios could fall significantly from their current levels if we don’t see a change in sentiment.

S&P 500 (SPY)

Anyway, by days end, it became clear that 3,130 was resistance, and 3,110 was acting as support. So what happens today? I’m still in the camp that this region is around the bottom. We remain in oversold conditions on the RSI, and as I showed you in the chart above, the number of stocks below their respective moving average suggests they bounce.
3rd party Ad. Not an offer or recommendation by Investing.com. See disclosure here or remove ads .
S&P 500 Index

Acadia (ACAD)

ACADIA Pharmaceuticals (NASDAQ:ACAD) reported strong results beating on the top and bottom, and guiding revenue well above expectations. The stock is trading up to around $41.30 after hours. I’m interested in what they say on the call.
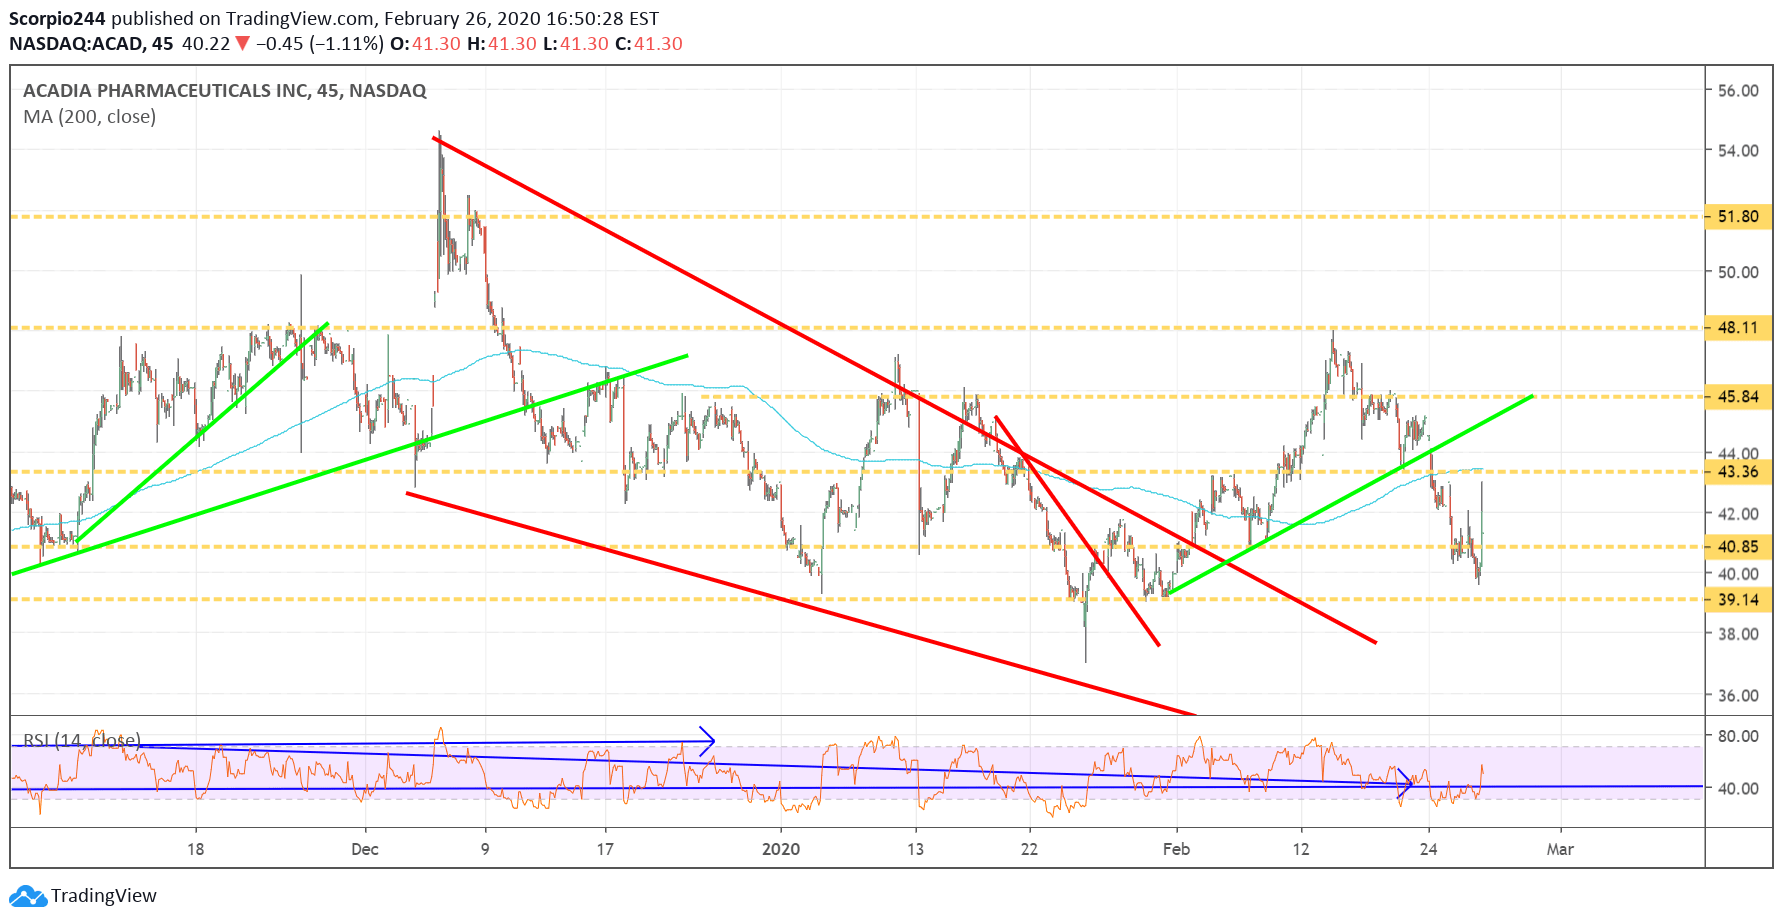
Acadia Inc Chart

Square (SQ)

Square (NYSE:SQ) is popping after reporting better than expected results and guiding inline. The stock is jumping, filling the gap up to $83 in the after hours. That is resistance, be careful here.
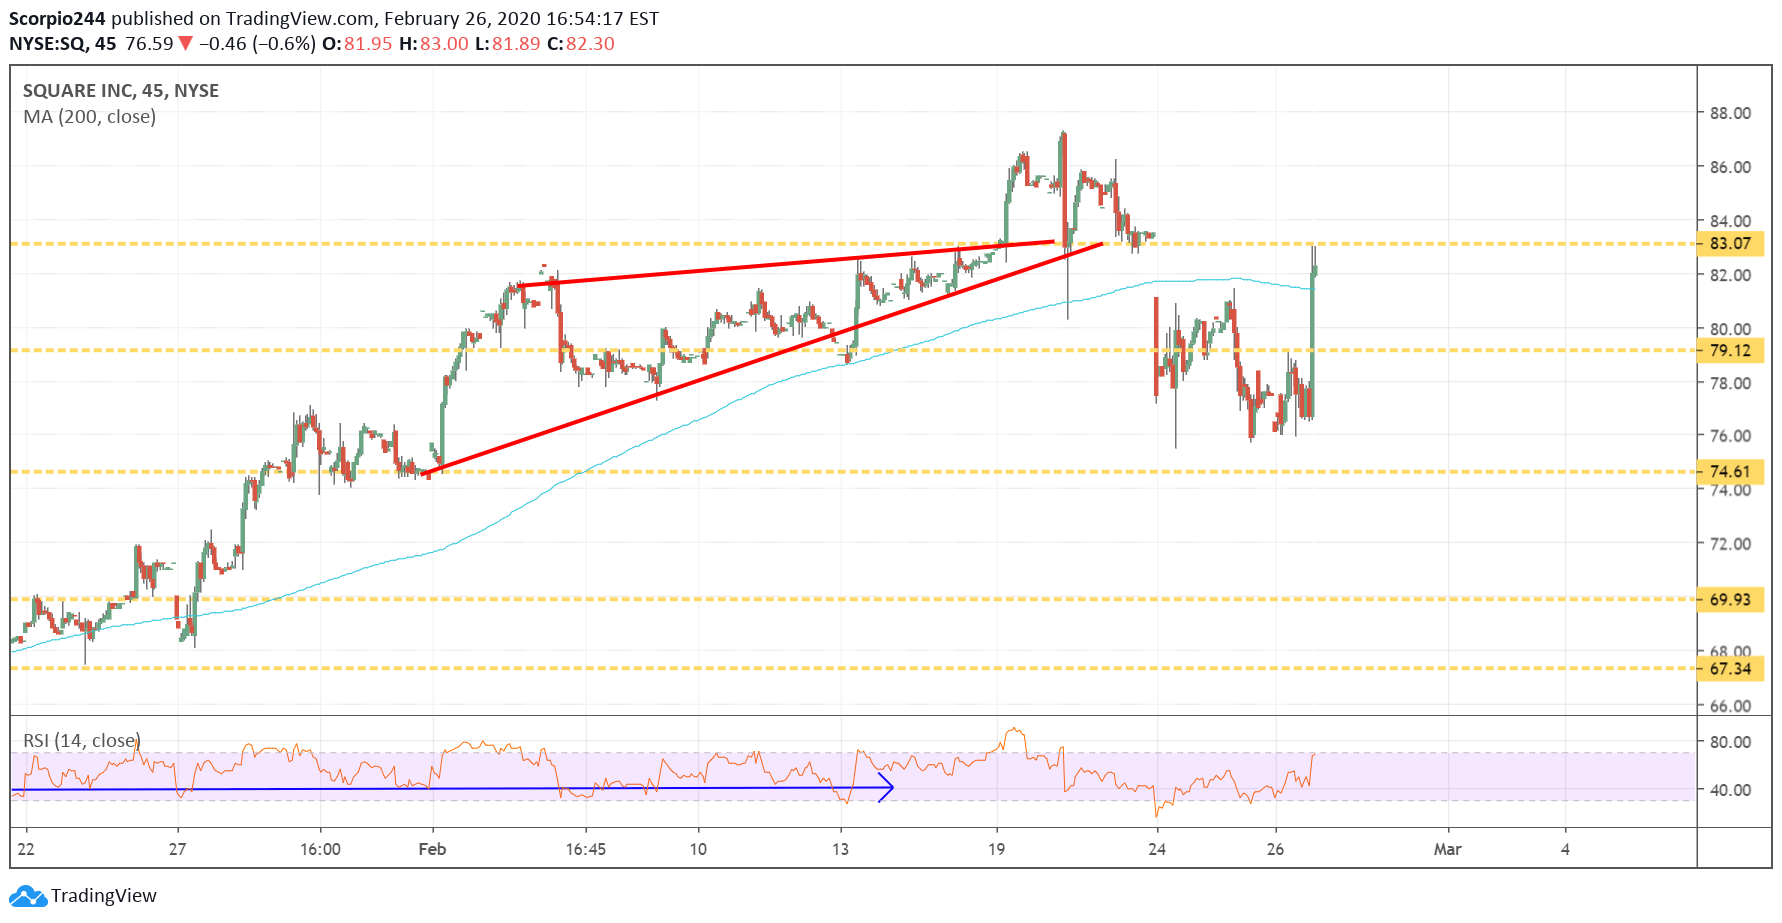
Square Inc Chart

Microsoft (MSFT)

Microsoft (NASDAQ:MSFT) is falling after announcing it would not meet guidance on its More Personal Computing unit guidance. The stock is trading around the range it has been in the last few days.
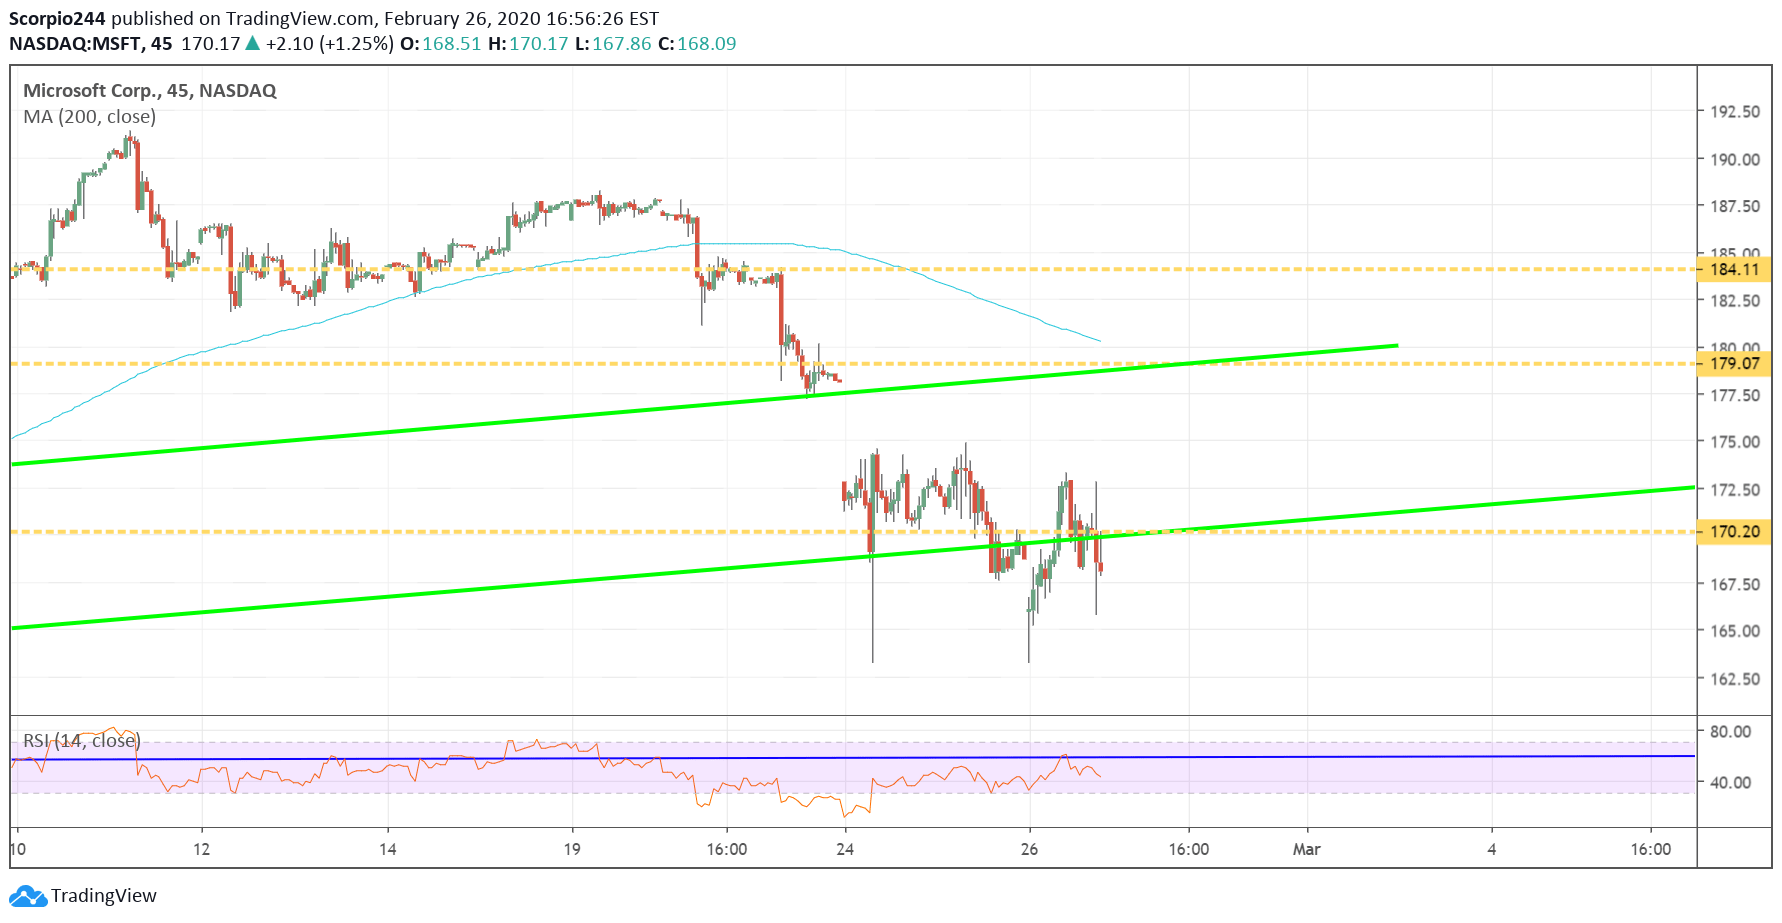
Microsoft Chart

Original Post

Latest comments

Wait until a month from now. Like a pot of soup on the stove, it takes awhile for the full aroma to fill the room. Not until then can you tell if it's feast or famine on the stove!
hang in there. thanks
First sentence corrected: Well, sometimes technical analysis does not work.
Well, sometimes technical analysis does work. Especially not in a headline-driven environment. If more bad news comes in, markets will fall further regardless any technical signals (like RSI) to the contrary.
Risk Disclosure: Trading in financial instruments and/or cryptocurrencies involves high risks including the risk of losing some, or all, of your investment amount, and may not be suitable for all investors. Prices of cryptocurrencies are extremely volatile and may be affected by external factors such as financial, regulatory or political events. Trading on margin increases the financial risks.
Before deciding to trade in financial instrument or cryptocurrencies you should be fully informed of the risks and costs associated with trading the financial markets, carefully consider your investment objectives, level of experience, and risk appetite, and seek professional advice where needed.
Fusion Media would like to remind you that the data contained in this website is not necessarily real-time nor accurate. The data and prices on the website are not necessarily provided by any market or exchange, but may be provided by market makers, and so prices may not be accurate and may differ from the actual price at any given market, meaning prices are indicative and not appropriate for trading purposes. Fusion Media and any provider of the data contained in this website will not accept liability for any loss or damage as a result of your trading, or your reliance on the information contained within this website.
It is prohibited to use, store, reproduce, display, modify, transmit or distribute the data contained in this website without the explicit prior written permission of Fusion Media and/or the data provider. All intellectual property rights are reserved by the providers and/or the exchange providing the data contained in this website.
Fusion Media may be compensated by the advertisers that appear on the website, based on your interaction with the advertisements or advertisers.
© 2007-2024 - Fusion Media Limited. All Rights Reserved.