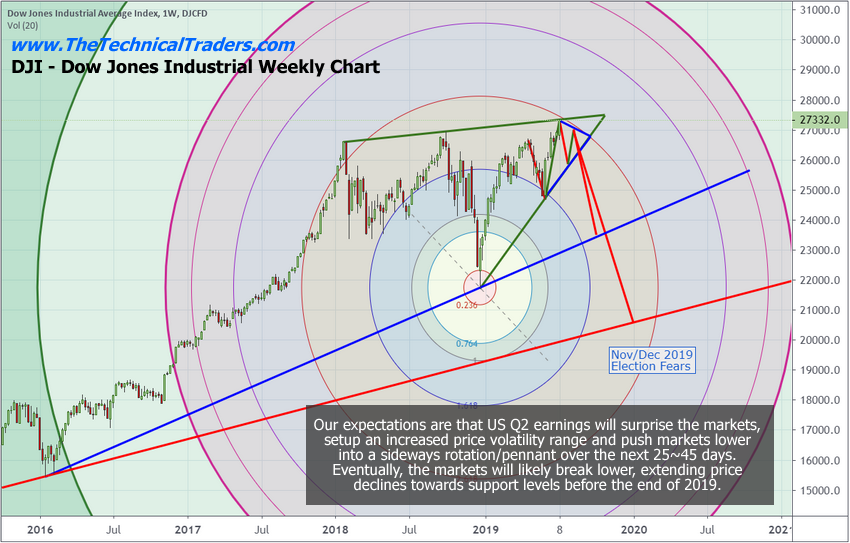
I believe the outcome of the past 6+ months with regards to global trade, currency devaluations, and consumer sentiment will result in weaker US earnings in Q2 than at any time over the past 3+ years. We believe US stocks, after recently breaching key psychological price levels ($300 SPY and $3000 ES) are poised to set up a sideways Pennant price pattern formation headed into a key price breakdown near the middle of August 2019.
Our cycle indicator tools and predictive modeling suggests that August 19, 2019, is the date to watch out for and after that date, we believe the US and global stock markets may begin a new downward price phase that could lead to a dramatic price decline.
This week I will share a report showing some really interesting charts rm a very different point of view that signal a larger correction is coming based on some leading sectors and proprietary analysis.
Earning Season Expectations For This Week
Early this week, July 15 through July 19, a total of 173 companies will be reporting earnings – including a number of very large firms such as Bank Of America (BAC), Alcoa (NYSE:AA), US Bancorp (NYSE:USB), IBM (NYSE:IBM), Bank of New York Mellon Corp (NYSE:BK), E-Bay (EBAY), Netflix (NASDAQ:NFLX), Charles Schwab (NYSE:SCHW), Citigroup (NYSE:C), United Airlines (UAL), JP Morgan Chase & Co (NYSE:JPM), Wells Fargo & Co (NYSE:WFC) and others. The mix of reporting firms this week includes financial, consumer, basic materials, healthcare, home builders and many others.
If anything has disrupted these industries over the past 3+ months it has been the shock to the markets related to the October 2018 to December 2018 US stock market price collapse and the continuing trade wars/issues with China. It is our opinion that these trade wars and pricing disruptions have resulted in a much more difficult environment for certain US and foreign nations to achieve Q2 expectations. Thus, we are planning for a few interesting surprises over the next 10 to 15+ days.
Next week, July 22 through July 26, a total of 659 companies will be reporting earnings. We believe the bulk of these earnings reports will provide increased US and global market price volatility and could actually present a number of surprise results (both positive and negative).
The Nasdaq website reported this article on June 17, 2019, which we found interesting.
Expectations for Q2 2019, and to be quite honest – the rest of 2019, is overall quite negative from this article. We believe the US markets will still be the top-performing global stock market because of the strength of the US economy and dynamic foundation of growth and opportunity going forward 2 to 4+ years. But we are very concerned that the second half of 2019 stock market correction is about to hit and shock traders with a -15% to -20% (or more) price collapse initiated by the recent psychological price levels being breached and the Q2 earnings data that could shock the global markets.
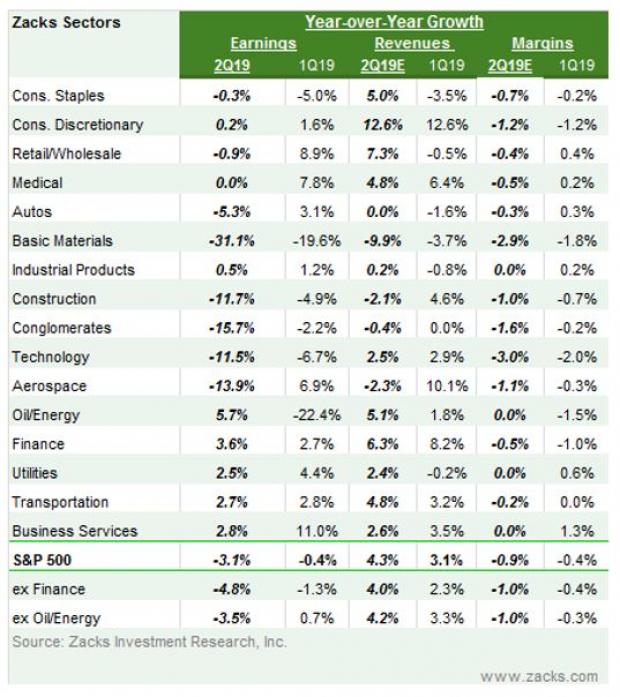
From the Nasdaq article, Zacks Sector analysis for Q2 vs. Q1 2019 shows concern in a number of sectors while Consumer Discretionary and Retail/Wholesale shows Revenues increase and Margins fall. Overall, it is quite distressing to see these expectations when one considers the strong economic data being released recently.

The computer and technology sector seems uniquely poised for a very rough year based on Zachs expectations. Overall, Q1 2019 earnings expectations were -6.7%, Q2 2019 earnings expectations are -11.5% and Q3 earnings expectations are -11.5%. This does not look like a very positive set of data for the rest of this year and we believe this is where the real risk of a US stock market price collapse resides.

Our Index Prediction Looking Forward
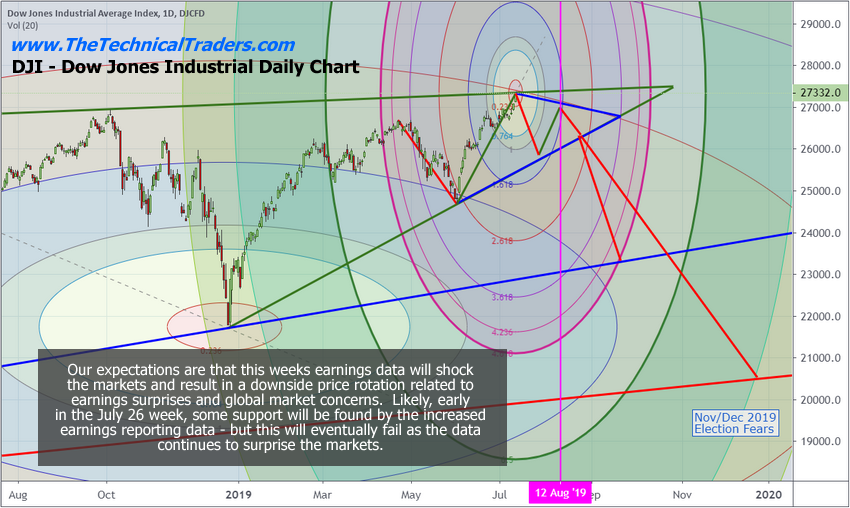
Months ago, we warned that a July 2019 market top is setting up and that we believed the US stock market would rotate much lower after a peak in July setup. About 45 days ago, we adjusted our expectations to suggest that this top would likely form in August or early September based on our predictive modeling system output and our cycle tools. We’ve honed the date down to August 19, 2019 (+/- 5 days) as the date that we believe the US stock market will TOP and/or initiate a new downside price move from this date.
You can see from the chart, below, that we believe the current price top may actually be near the highest point reached over the next 30+ days. We believe earnings data will change the dynamics of price activity and increase volatility over the next 2 to 3 weeks. Setting up a sideways Pennant price formation as the global markets and investors digest this new economic data. Ultimately, a price breakdown is likely (a price revaluation event) that will allow for continued upside price growth in the future.

This Daily DJI chart highlights our expectations and highlights our Fibonacci Price Amplitude Arcs that suggest the true price top formation will happen sometime near August 19, 2019. We believe this date is critical and that price could begin a very quick and dramatic downside price move near this date based on the data we are expecting to see from Q2 earnings.

Previously we’ve suggested a simple trade setup technique we use to identify entry and exit points – the 100% Fibonacci Extension Move.
Earnings and Prediction Conclusion:
We urge traders to plan and prepare for this potential setup by reducing risk in long positions and preparing for a potential downside price move that could be related to global market concerns, Q2 earnings data and continued global trade/economic issues.
Overall, once this price revaluation event is completed, much like the event in Oct~Dec 2018 and the event in May 2019, the US stock market will very likely resume the upward price bias/trend and continue to attempt to establish new all-time price highs into 2020 and beyond.
Price rotations, like the one we are suggesting, may happen after August 19, 2019, are very healthy for the markets. These types of moves allow price to establish support and resistance levels, revalue assets, shake out certain biases and provide for future price moves/trends.
Be prepared. The data may result in a very big increase in volatility over the next 10~15+ days and this could result in a very dramatic price correction setting up as we’ve suggested. Learn how our research team can help you stay ahead of these bigger market moves and find incredible trading opportunities as these big moves take place.
