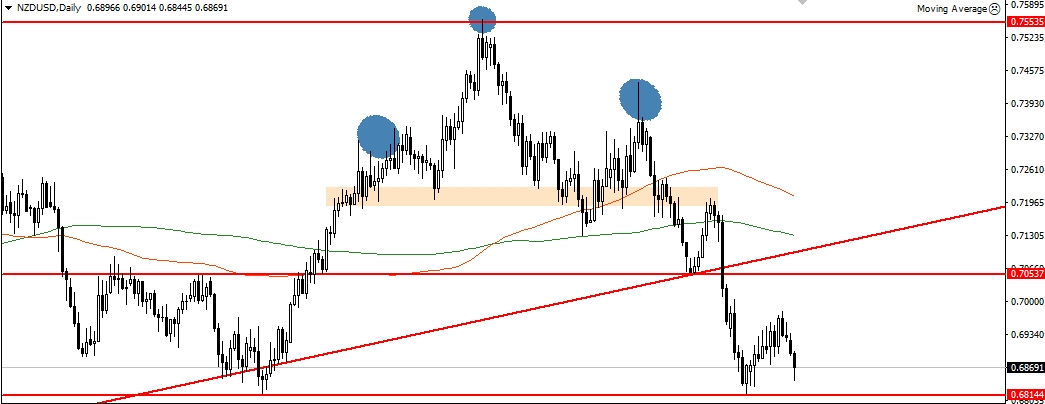
The medium-term bullish rally in the NZD/USD pair has come to an end after the pair hit the critical resistance level at 0.75535.The sellers took control of the market and push the pair down towards the critical support level at 0.71281.This level provides a significant amount of buying pressure to the Kiwi dollars and resulted in another ascending wave in the daily chart. But the bulls failed to break the high of 27th July 2017 and formed a head and should pattern in the daily chart. Most of the professional traders waited patiently on the sideline for the clear breakout of the neckline support at 0.71876 to execute their short orders. However, the conservative traders went short in this pair with a breakout of the 200-day dynamic support level at 0.71519.
Figure: Formation of head and shoulder pattern in the NZD/USD pair
In the above figure, you can clearly see how the bears took control of the market after the clear breakout of the neckline support level at 0.71876.Those who missed the first time short taking opportunity didn’t have to regret as the market retraced back to give a second chance to the traders. The pair has completed its fall in the daily chart and found some decent support at 0.68144 level. Most of the professional private investor are looking for bullish price action confirmation signal in the NZD/USD pair to execute their long orders as there is plenty of support below the current price level.
If the bulls manage to take control of this market form this level then the ultimate target for this pair would be the first critical resistance level at 0.70537.From the level, the sellers will try to take control of this market but a daily closing of the price above that level will ultimately lead this pair towards the 100 days SMA. On the contrary, a clear break of the critical support level at 0.68144 will confirm the establishment of medium-term bearish trend and the next bearish stop for this pair would be the critical support level at 0.6649.
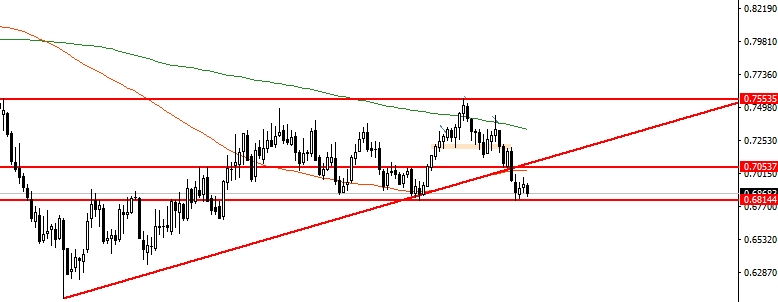
NZD/USD weekly chart analysis
Figure: Clear break of the weekly bullish trend line support
In the above figure, you can clearly see that the pair has breached the weekly trend line support level at 0.70537 and currently testing the critical support level at 0.68144.If this support level holds then we will have a double bottom formation in the weekly chart which will help the Kiwi bulls to rally significantly higher in the global market. The first bullish target will be the broken trend line resistance level at 0.7053.From that level, we might see some bears but a daily closing of the price above that level will lead this pair towards the 200 weekly SMA. If the pair retest the 200 weekly SMA then we might see some false spike so selling without any price action confirmation signal will be an immature act. But a clear break of the high of 27th July 2017 will confirm the establishment of a long-term bullish trend in the NZD/USD pair.
On the downside the first critical support level for this pair the low of 11th May 2017.From that level, we might see some decent bullish bounce of in this pair. Most of the leading investors are currently waiting for the FED third rate hike decision to get a clear clue regarding the Kiwi dollar next movement. Though the current performance of the U.S economy is not up to the mark if the U.S central bank manages to trim their current balance sheet then a rate hike on the month of December will not be a surprising event. Considering all the facts the Kiwi dollar is trading at a very critical zone. We will wait on the sideline to get a more precise trading signal.

