The negative sentiment in tech stocks right now won't necessarily keep traders from beating each other with a stick to try and get their hands on the newly listed Spotify shares as soon as they open.
At this point, investors are really looking for something fresh and even though the company is losing money, they have more paid subscribers than any Western music streaming service.
The fact that they aren't introducing any new shares means that nobody can be certain how many will be available to meet the demand. This could get messy.
Note: The Premium Market Webinar will begin today at 15:00 GMT. If you haven't registered yet, please click here now.
Today's Highlights
Dow[n] Behind Enemy Lines
A Touch of Safe Havens
Cryptos are Finally Green
Please note: All data, figures and graphs are valid as of April 3rd. All trading carries risk. Only risk capital you can afford to lose.
Traditional Markets
It was the worst start to Q2 since 1929. At one point the Nasdaq was down more than 3.5%. The word bloodbath has been used a few times. The only reason it hasn't been used more aggressively is that many believe that this isn't over just yet.
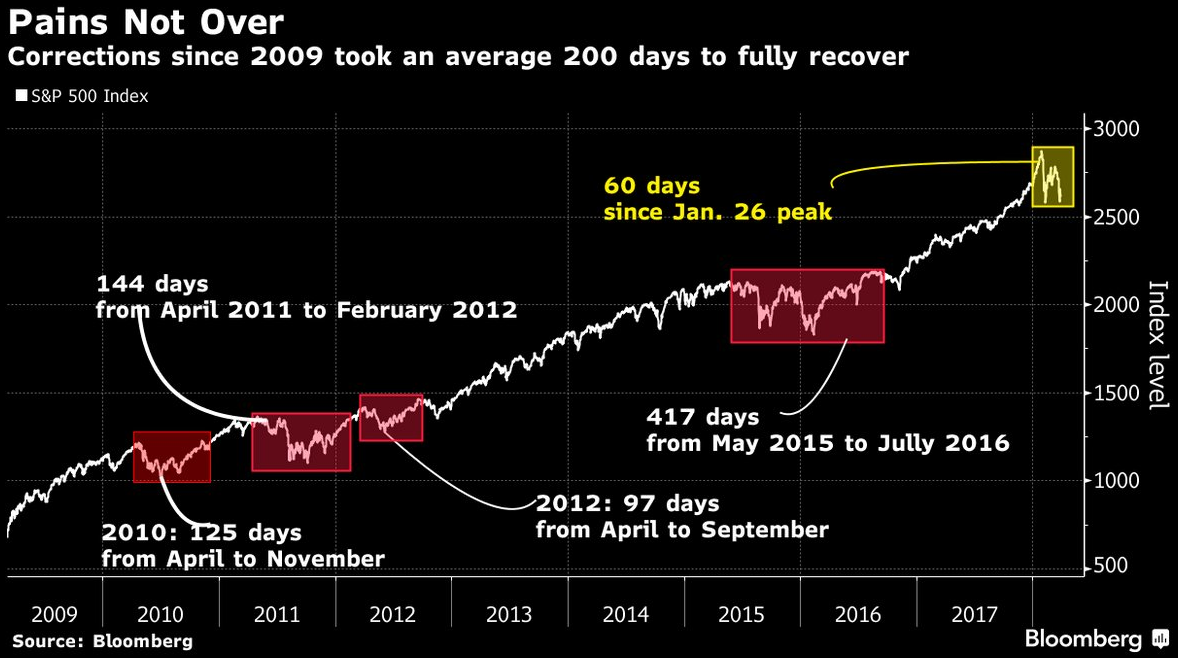
For reference, here is a map of the major corrections in the S&P 500 over the last decade. Not included below is the crash of 2008.
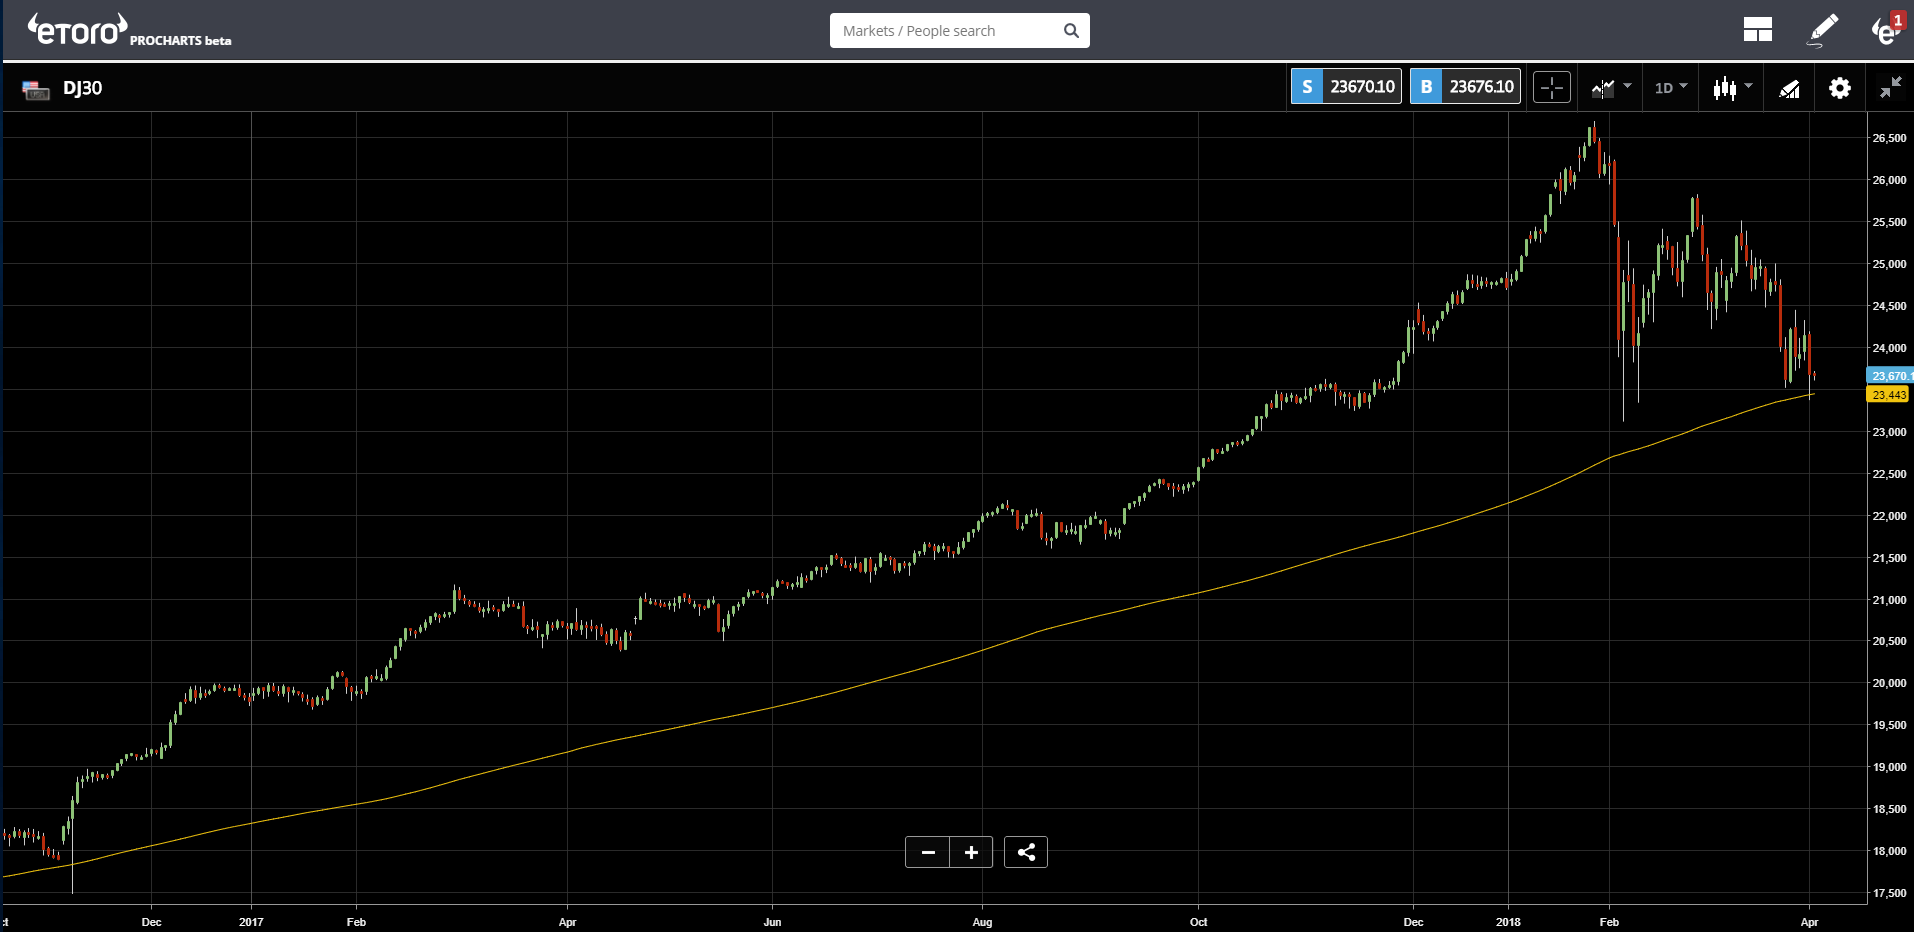
One thing that had people particularly worried is the break below the 200 day moving averages on the Dow Jones, something that financial media was calling the "lines of defense."
All the major stock indices in Asia, Europe, and the USA are currently in red territory since the beginning of the year.
Sentiment??
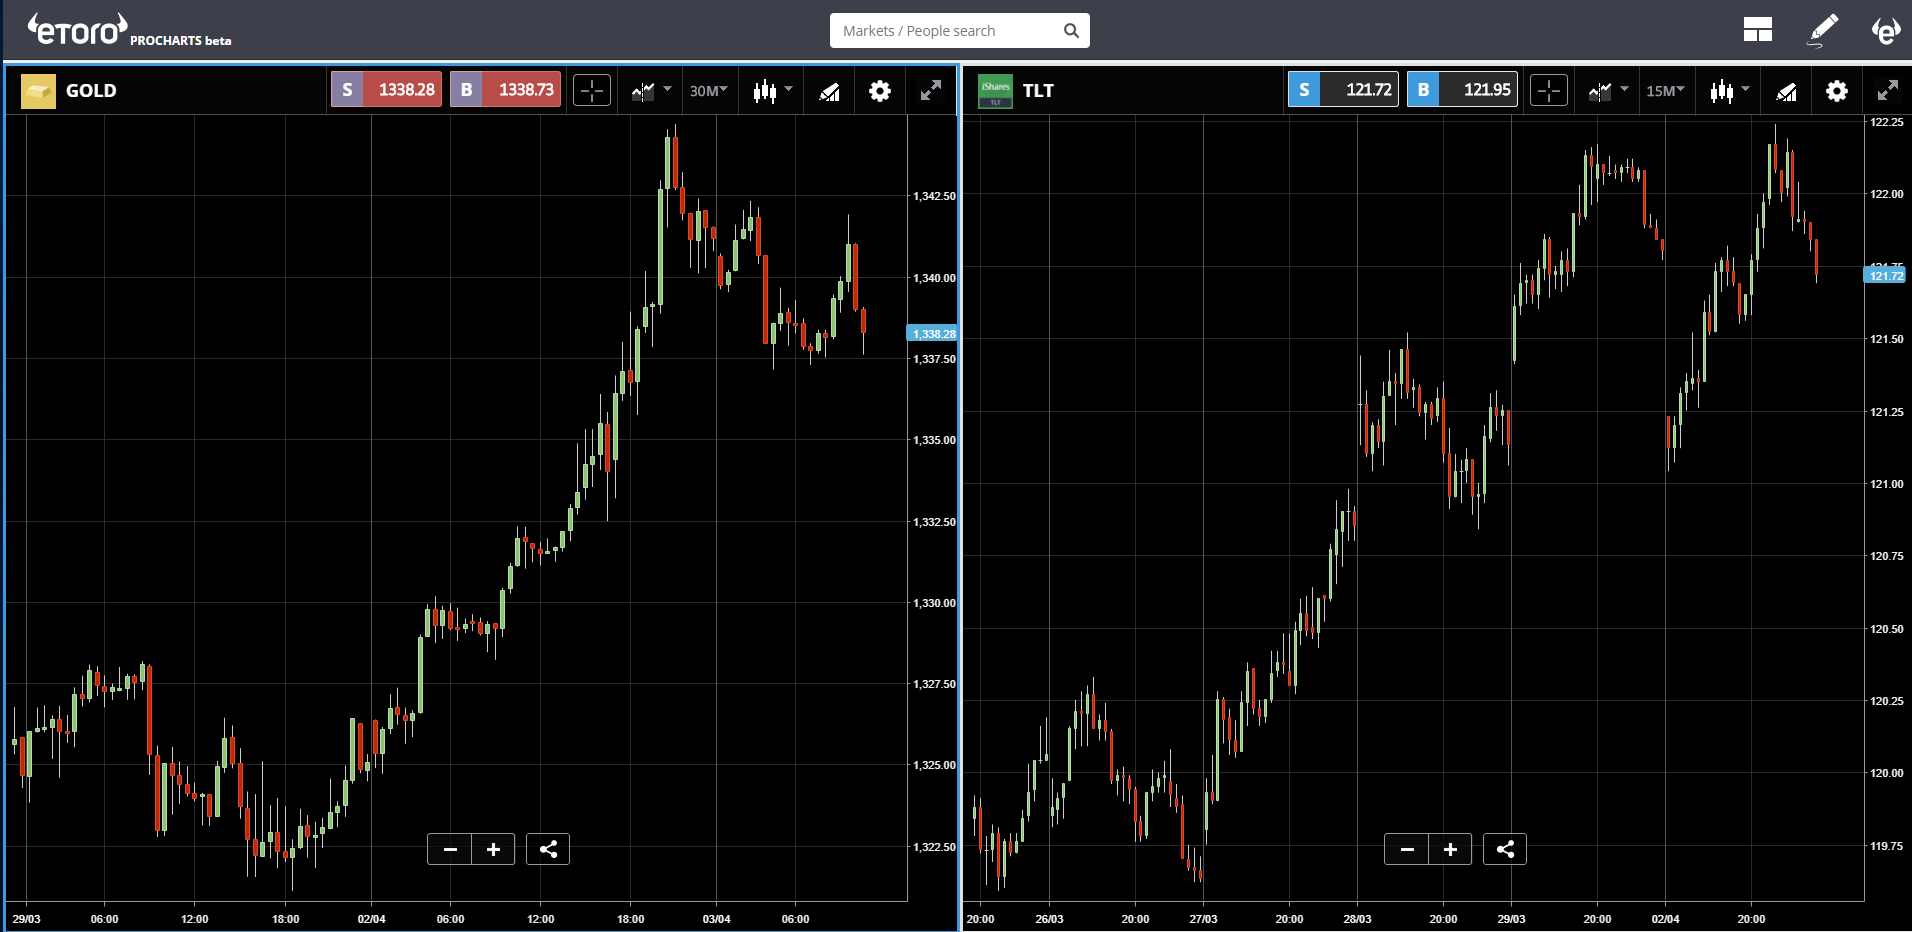
Some strange stuff here. As one would expect from a major stock sell off, we are seeing some buying pressure in gold and in treasury bonds.
The weird thing is in the currency markets where the safe havens are among the worst performers so far this month.
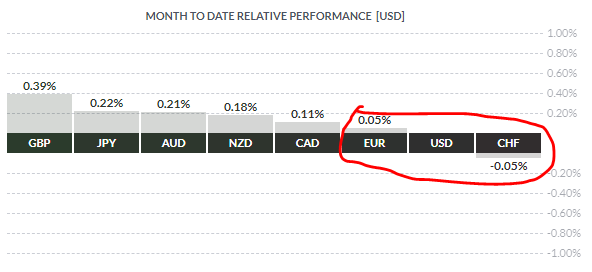
The only exception being the Japanese yen which is somehow miraculously rising despite the political tensions in Japan abating.
Cryptos in Green
Breaking the sour mood we have seen some shiny green numbers in the crypto-market lately. Whether this should be seen as a foresight of what will happen with the stocks only time will tell.
The best performer by far has been stellar.
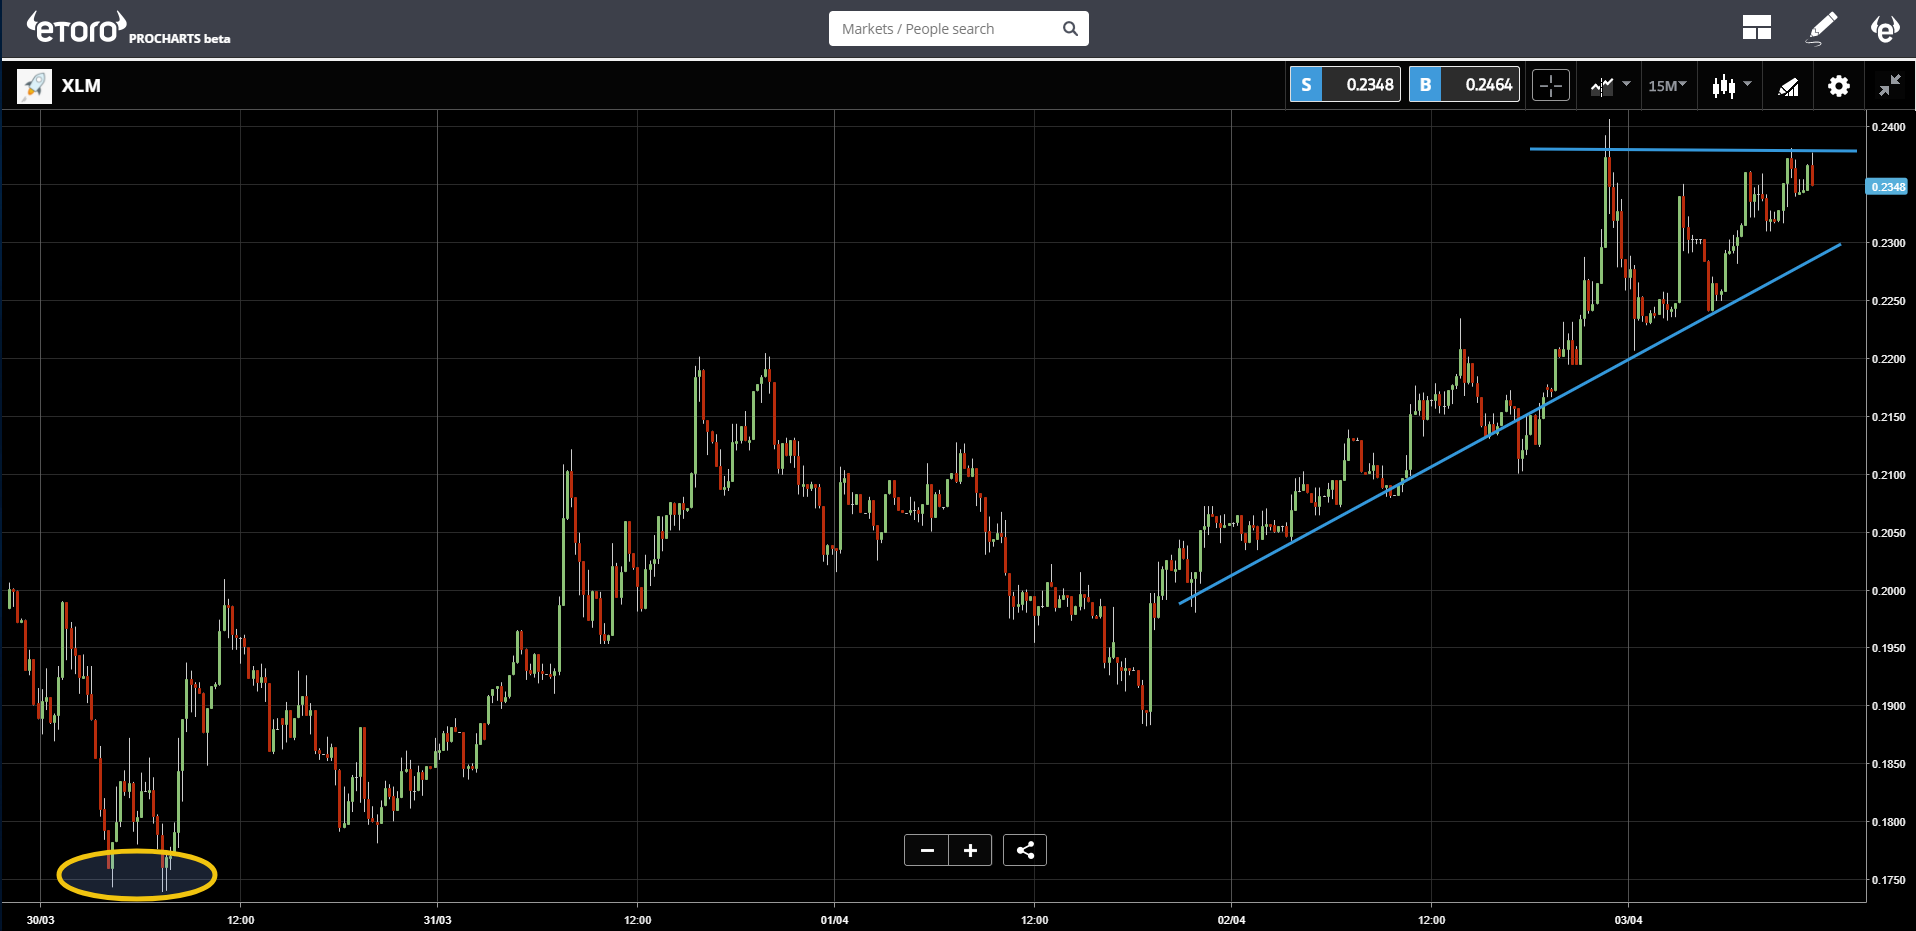
XLM tokens are up 38% since March 30th and the chart is showing a picture perfect push off the lows. Notice the double bottom (yellow) and the rising wedge (blue).
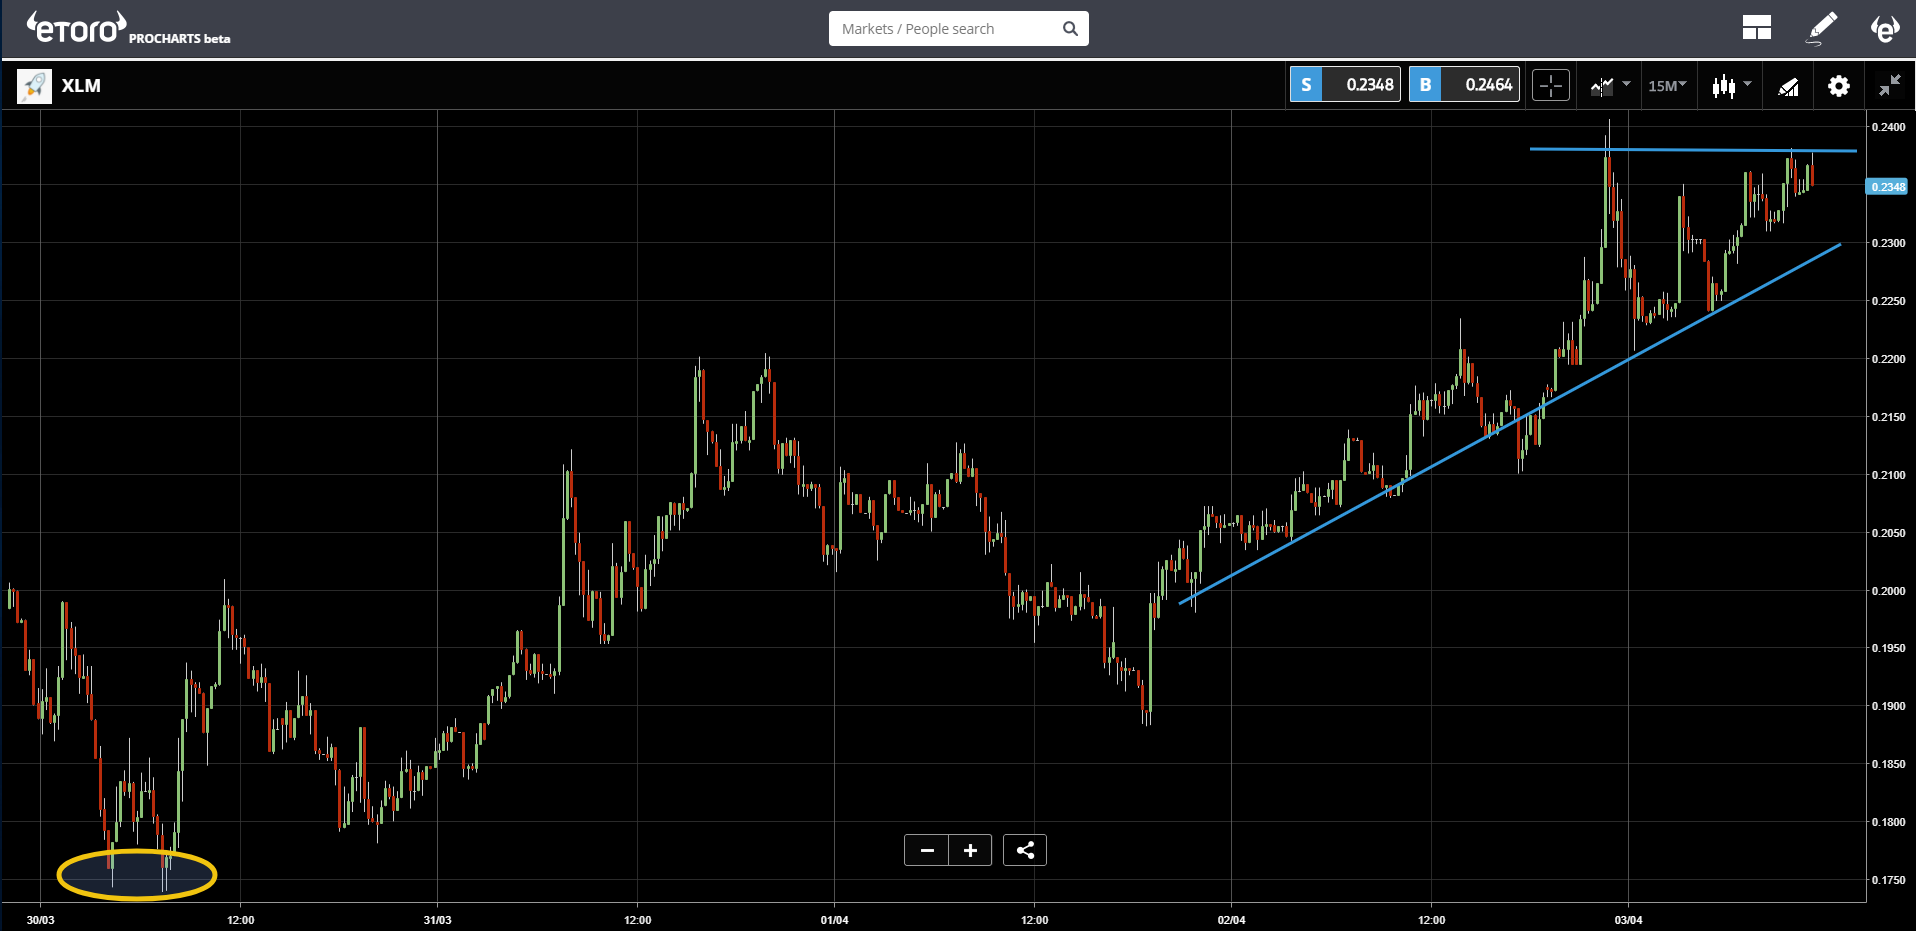
The phrase "he who picks bottoms gets dirty fingers" really applies here. But even though it may be too early to say that we won't go lower this is certainly an encouraging sign.
eToro, Senior Market Analyst
Disclosure: This content is for information and educational purposes only and should not be considered investment advice or an investment recommendation. Past performance is not an indication of future results. All trading carries risk. Only risk capital you're prepared to lose.
