The Dow Jones Industrial Average rallies but doesn’t keep up with SP500 and Nasdaq
Major indexes rallied strongly last week on the strength of Google Inc, (GOOG) and Morgan Stanley, (MS) earnings, but the Dow Jones Industrial Average (DIA) was weighed down by International Business Machines, (IBM).
Friday saw more strong buying as the Wall Street Journal reported that the Fed was unlikely to cut back on quantitative easing in October.
Google (GOOG) powered the Nasdaq (QQQ) higher as the company’s stock broke $1,000 for the first time, gaining more than 13% after a positive earnings report.
General Electric (GE) managed to jump 3.53 percent despite falling a penny short of earnings estimates of 37 cents per share.
The Dow Jones Industrial Average (DIA) picked up 28 points to finish Friday’s trading session at 15,399 for a 0.18 percent advance. The S&P 500 (SPY) surged 0.65 percent to a record-high close at 1,744.50 after hitting a new record intraday high of 1,745.31
China reported that its GDP expanded at an annual rate of 7.8 percent during the third quarter, compared with 7.5 percent expansion during the second quarter. For the first three quarters of 2013, the economy has grown at an annual rate of 7.7 percent, putting the nation ahead of its 7.5 percent growth target – so far.
China’s industrial production increased by 10.2 percent in September, as expected by economists. The nation’s retail sales rose 13.3 percent during the month. The Shanghai Composite Index climbed 0.24 percent to close at 2,193 (FXI). Hong Kong’s Hang Seng Index jumped 1.06 percent to end the day at 23,340 (EWH).
In Europe, earnings reporting season has brought mixed results. Nevertheless, European investors were willing to embrace risk as a result of the strong economic data from China, as well as the expectations that America’s quantitative easing program will continue, unabated, for the foreseeable future. The Euro STOXX 50 Index finished Friday’s session with a 0.76 percent surge to 3,033 – climbing further above its 50-day moving average of 2,871. Its Relative Strength Index is 72.52. Because most investors consider an RSI above 70 as an “overbought” signal, we could see a pullback (FEZ).
The big story last week was the temporary settlement of the budget standoff as Congress and the White House punted again and put off the next deadline until mid-December for financing the government and mid-January for raising the debt ceiling. So it’s a temporary fix but temporary was better than none and so markets celebrated the outcome.
Next Tuesday we’ll see September’s Non Farm Payrolls and Unemployment report which as delayed due to the shutdown.
For the week, the Dow Jones Industrial Average (DIA) rose 1.1%, the Nasdaq (QQQ) climbed 3.2% and the S&P 500 (SPY) jumped 2.4%.
So now, we’re halfway through October, and October 19th was the anniversary of “Black Monday” in 1987 when the Dow Jones Industrial Average (DIA) dropped 22.6% in one day.
Other major October events include:
- Black Friday: Oct. 29, 1929: Dow Jones drops 12.8%.
- Black Monday: Oct. 19, 1987: Dow Jones loses 22.6%.
- Friday the 13th, 1989 Mini-Crash: Dow Jones falls 6.91%.
- Oct. 27, 1997 Mini Crash: Dow Jones drops 550 points, or 7.2%.
- Black Week: Beginning Oct. 6, 2008: Dow Jones drops 18.2% for the week.
- Oct. 15, 2008: Dow sinks 733 points (7.87%)
- Oct. 22, 2008: Dow falls 514 points (5.69%) after weak third-quarter earnings season drives home the message that the recession is seriously bad.
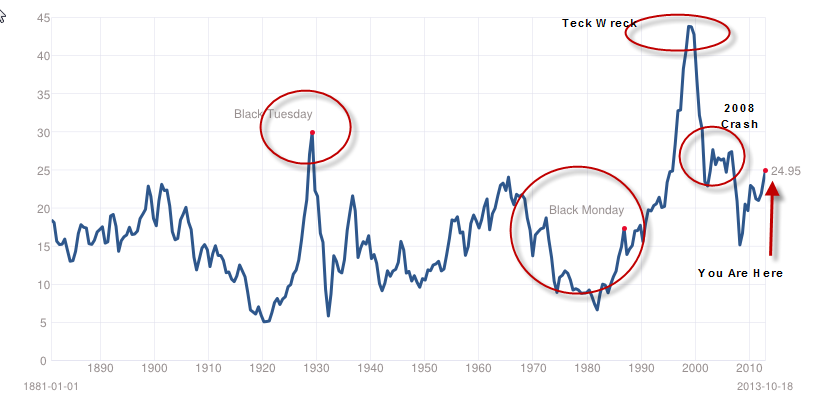
So while things are looking optimistic and exuberant, a glance at the following chart is reason for pause
The chart is a graphic indicator of how current conditions regarding price/earnings puts us in the region of significant market declines and so at least a measure caution is perhaps in order as we move through the last two weeks of October.
Bottom line: Stocks make new highs but the Dow Jones Industrial Average (DIA) lags as investors head into the last two weeks of October. October is also historically the start of many bull markets and the start of the “Best Six Months of the Year,” according to Stock Traders Almanac. The Almanac says that most market gains come between November and May and so bulls are looking forward to the potentially ghoulish October to give way to the powerful year end rally that we oftentimes see.
Disclaimer: The content included herein is for educational and informational purposes only, and readers agree to Wall Street Sector Selector's Disclaimer, Terms of Use, and Privacy Policy before accessing or using this or any other publication by Wall Street Sector Selector or Ridgeline Media Group, LLC.
