The Dow Jones Industrial Average and other major U.S. indexes defy gravity and set more records.
The Dow Jones Industrial Average (DIA) gained 0.3% on Friday to set a new record and post a weekly advance of 3%.
The SP500 (SPY) closed at a new high of 1818 for a gain of 2.4% on the week. The Nasdaq Composite (QQQ) set a comparable gain of 2.6% for the week.
After spending two weeks worrying about the Federal Reserve and its tapering plans, markets shrugged off those concerns last week and seemingly began their traditional Christmas and early New Year rally.
On My Stock Market Radar
In the chart of the Dow Jones Average (DIA) below, we can see how the index has broken all resistance as it pushed to new highs last week.
Momentum and trend are both up while relative strength nears overbought levels. The index tested and successfully held its 50 day moving average earlier in December and now the 50 and 200 day averages are both in up trends.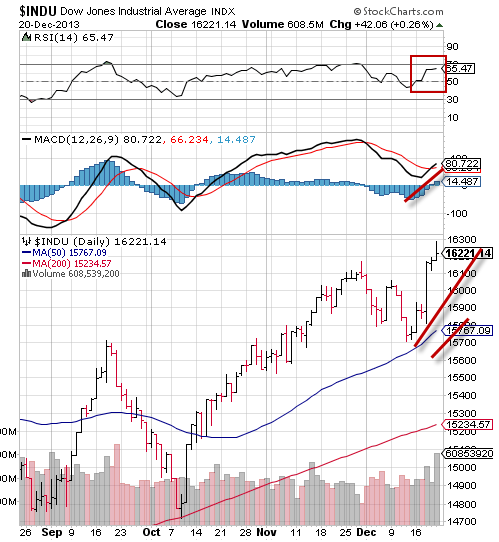
The Q3 GDP report came in much, much stronger than expected with a growth rate of 4.1% and this seemed to encourage investors that economic growth could finally become sustainable without major liquidity injections from the Federal Reserve.
Homebuilder confidence was also higher as housing starts rose to their highest levels in five years. Industrial production climbed while Europe posted a positive manufacturing report.
On the downside, initial jobless claims rose week over week and missed expectations while building permits and existing home sales fell.
Last week was also “quadruple witching,” the last day of the month for several options and futures contracts, which added to market volatility. More volatility can be expected in coming weeks as the market adjusts to life with reduced intervention by the Federal Reserve.
Next week will be light on economic reports with the Christmas Holiday and many traders head home for Holiday vacations.
Monday brings personal income and consumer spending for November, along with University of Michigan consumer sentiment.
Tuesday sees November new home sales and durable goods orders while Thursday brings the usual weekly jobless claims report.
Bottom line: For today, everything looks positively bullish as fundamentals, technical factors and seasonality all point to higher prices ahead. The Christmas rally will likely continue into the New Year, fueled by continuing Federal Reserve liquidity, however, many red lights flash warning signs ahead.
Troubling elements include near record margin debt, overly positive adviser and retail investor sentiment and overbought conditions that resemble other periods just prior to significant market tops. Ultra-high levels of fundamental and technical bullish sentiment prevail, and while no one has a crystal ball, it’s quite clear that a very significant market correction lies sometime ahead.
Disclaimer: The content included herein is for educational and informational purposes only, and readers agree to Wall Street Sector Selector's Disclaimer, Terms of Use, and Privacy Policy before accessing or using this or any other publication by Wall Street Sector Selector or Ridgeline Media Group, LLC.
- English (UK)
- English (India)
- English (Canada)
- English (Australia)
- English (South Africa)
- English (Philippines)
- English (Nigeria)
- Deutsch
- Español (España)
- Español (México)
- Français
- Italiano
- Nederlands
- Português (Portugal)
- Polski
- Português (Brasil)
- Русский
- Türkçe
- العربية
- Ελληνικά
- Svenska
- Suomi
- עברית
- 日本語
- 한국어
- 简体中文
- 繁體中文
- Bahasa Indonesia
- Bahasa Melayu
- ไทย
- Tiếng Việt
- हिंदी
Dow Jones Industrial Average Sets Yet Another Record
Published 12/22/2013, 10:31 AM
Updated 05/14/2017, 06:45 AM
Dow Jones Industrial Average Sets Yet Another Record
Latest comments
Loading next article…
Install Our App
Risk Disclosure: Trading in financial instruments and/or cryptocurrencies involves high risks including the risk of losing some, or all, of your investment amount, and may not be suitable for all investors. Prices of cryptocurrencies are extremely volatile and may be affected by external factors such as financial, regulatory or political events. Trading on margin increases the financial risks.
Before deciding to trade in financial instrument or cryptocurrencies you should be fully informed of the risks and costs associated with trading the financial markets, carefully consider your investment objectives, level of experience, and risk appetite, and seek professional advice where needed.
Fusion Media would like to remind you that the data contained in this website is not necessarily real-time nor accurate. The data and prices on the website are not necessarily provided by any market or exchange, but may be provided by market makers, and so prices may not be accurate and may differ from the actual price at any given market, meaning prices are indicative and not appropriate for trading purposes. Fusion Media and any provider of the data contained in this website will not accept liability for any loss or damage as a result of your trading, or your reliance on the information contained within this website.
It is prohibited to use, store, reproduce, display, modify, transmit or distribute the data contained in this website without the explicit prior written permission of Fusion Media and/or the data provider. All intellectual property rights are reserved by the providers and/or the exchange providing the data contained in this website.
Fusion Media may be compensated by the advertisers that appear on the website, based on your interaction with the advertisements or advertisers.
© 2007-2024 - Fusion Media Limited. All Rights Reserved.