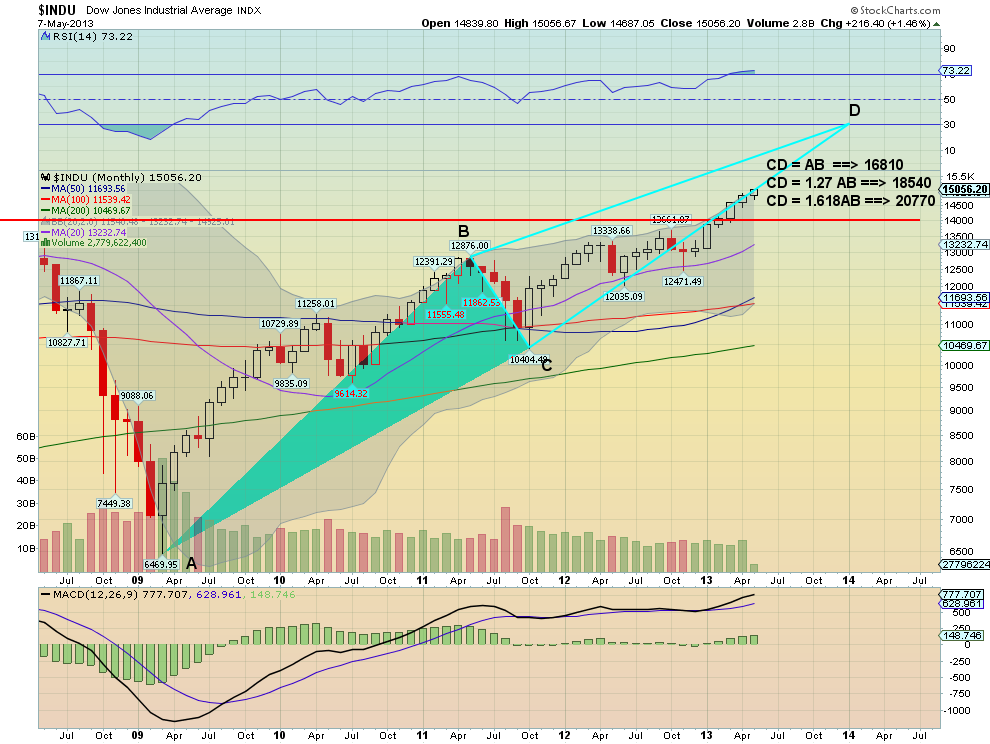
With the Dow Jones Industrial Average closing over the 15,000 mark for the first time ever, it begs the question, just how high can it go? This will not be a 200 page book on the subject using historical P/E ratios or other measures. A simple Harmonic pattern shows that a reasonable target is 16,810 and that 20,770 is within the realm of possiblility. Take a look.
The move off of the March 2009 low to the peak at 12,876 in May 2011 took two years and two months. Using a simple AB = CD pattern applied to the Monthly chart of the Dow (US 30) gives initial target in December of 2013 to 16810, also a two-year and two-month run higher. But these patterns often extend by 127% or 161.8% of the initial leg. In that case the target could be as high as 18,540 or even 20,770 at year end. If you think that is crazy, then consider that the two peaks at that point could be part of a 3 Drives Pattern. This would give the corresponding targets in July 2016 of 19,854 on a straight AB=CD, 25,165 at a 127% extension and 33,400 at a 161.8% extension, assuming the same 20% pullback for 5 months as happened in May 2011 occurs following December 2013. One tool, one view.
The information in this blog post represents my own opinions and does not contain a recommendation for any particular security or investment. I or my affiliates may hold positions or other interests in securities mentioned in the Blog, please see my Disclaimer page for my full disclaimer.
Original post
- English (UK)
- English (India)
- English (Canada)
- English (Australia)
- English (South Africa)
- English (Philippines)
- English (Nigeria)
- Deutsch
- Español (España)
- Español (México)
- Français
- Italiano
- Nederlands
- Português (Portugal)
- Polski
- Português (Brasil)
- Русский
- Türkçe
- العربية
- Ελληνικά
- Svenska
- Suomi
- עברית
- 日本語
- 한국어
- 简体中文
- 繁體中文
- Bahasa Indonesia
- Bahasa Melayu
- ไทย
- Tiếng Việt
- हिंदी
Dow 20,000 Is Possible (This Year)
Published 05/08/2013, 08:45 AM
Updated 05/14/2017, 06:45 AM
Dow 20,000 Is Possible (This Year)
3rd party Ad. Not an offer or recommendation by Investing.com. See disclosure here or
remove ads
.
Latest comments
Install Our App
Risk Disclosure: Trading in financial instruments and/or cryptocurrencies involves high risks including the risk of losing some, or all, of your investment amount, and may not be suitable for all investors. Prices of cryptocurrencies are extremely volatile and may be affected by external factors such as financial, regulatory or political events. Trading on margin increases the financial risks.
Before deciding to trade in financial instrument or cryptocurrencies you should be fully informed of the risks and costs associated with trading the financial markets, carefully consider your investment objectives, level of experience, and risk appetite, and seek professional advice where needed.
Fusion Media would like to remind you that the data contained in this website is not necessarily real-time nor accurate. The data and prices on the website are not necessarily provided by any market or exchange, but may be provided by market makers, and so prices may not be accurate and may differ from the actual price at any given market, meaning prices are indicative and not appropriate for trading purposes. Fusion Media and any provider of the data contained in this website will not accept liability for any loss or damage as a result of your trading, or your reliance on the information contained within this website.
It is prohibited to use, store, reproduce, display, modify, transmit or distribute the data contained in this website without the explicit prior written permission of Fusion Media and/or the data provider. All intellectual property rights are reserved by the providers and/or the exchange providing the data contained in this website.
Fusion Media may be compensated by the advertisers that appear on the website, based on your interaction with the advertisements or advertisers.
© 2007-2024 - Fusion Media Limited. All Rights Reserved.
