Get 40% Off
💰 Buffett reveals a $6.7B stake in Chubb. Copy the full portfolio for FREE with InvestingPro’s Stock Ideas toolCopy Portfolio

AUD/USD Rallies Sharply, Forms Double Top

Published 10/09/2015, 06:49 AM
Updated 07/09/2023, 06:32 AM
AUD/USD
-

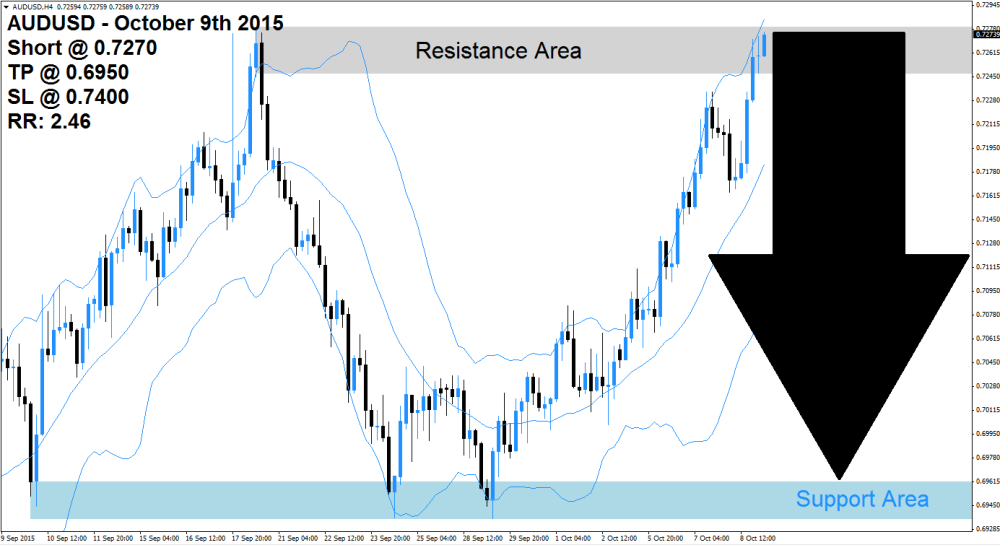
AUD/USD 4-Hour Chart

The AUD/USD has rallied sharply from its support area which is marked in light blue in the above H4 chart and how now reached its resistance are marked in light grey. Price action has now formed a double top chart pattern which further supports a sell-off in this currency pair.

The upper band of the Bollinger Band® indicator peak through the resistance area, but is expected to breakdown and reverse its advance. The middle band as well as the lower band are also sloping higher.

Price action is currently trading between the middle band and the upper band of the Bollinger Band indicator. A breakdown below the middle band would follow the breakdown below the resistance area and result in a trend change for the AUD/USD. Forex traders may use this as a good level to realize floating trading profits and exit their short positions. The profit taking sell-off is expected to push this currency pair back into its support area.

Forex traders are advised to enter short positions at 0.7270 and above in order to be well position for the expected profit taking sell-off in this currency pair and a break in the up-trend. Conservative forex traders should wait for price action to break down below the middle band of its Bollinger Band Indicator which will increase selling pressure. A take profit target of 0.6950 has been selected for a potential trading profit of 320pips. Forex traders should protect this trade with a stop loss level at 0.7400 for a potential trading loss of 130 pips which will result in a Risk-Reward (RR) ratio of 2.46.

3rd party Ad. Not an offer or recommendation by Investing.com. See disclosure here or remove ads .
  • Short at 0.7270
  • TP at 0.6950
  • SL at 0.7400
  • RR: 2.46

Latest comments

Short at 0.7270 fundamentally supported? IMO this market would go further upwards may be upto 0.75 level before the correction is over and would consolidate before starting the bear tren again.
Risk Disclosure: Trading in financial instruments and/or cryptocurrencies involves high risks including the risk of losing some, or all, of your investment amount, and may not be suitable for all investors. Prices of cryptocurrencies are extremely volatile and may be affected by external factors such as financial, regulatory or political events. Trading on margin increases the financial risks.
Before deciding to trade in financial instrument or cryptocurrencies you should be fully informed of the risks and costs associated with trading the financial markets, carefully consider your investment objectives, level of experience, and risk appetite, and seek professional advice where needed.
Fusion Media would like to remind you that the data contained in this website is not necessarily real-time nor accurate. The data and prices on the website are not necessarily provided by any market or exchange, but may be provided by market makers, and so prices may not be accurate and may differ from the actual price at any given market, meaning prices are indicative and not appropriate for trading purposes. Fusion Media and any provider of the data contained in this website will not accept liability for any loss or damage as a result of your trading, or your reliance on the information contained within this website.
It is prohibited to use, store, reproduce, display, modify, transmit or distribute the data contained in this website without the explicit prior written permission of Fusion Media and/or the data provider. All intellectual property rights are reserved by the providers and/or the exchange providing the data contained in this website.
Fusion Media may be compensated by the advertisers that appear on the website, based on your interaction with the advertisements or advertisers.
© 2007-2024 - Fusion Media Limited. All Rights Reserved.