This post was written exclusively for Investing.com
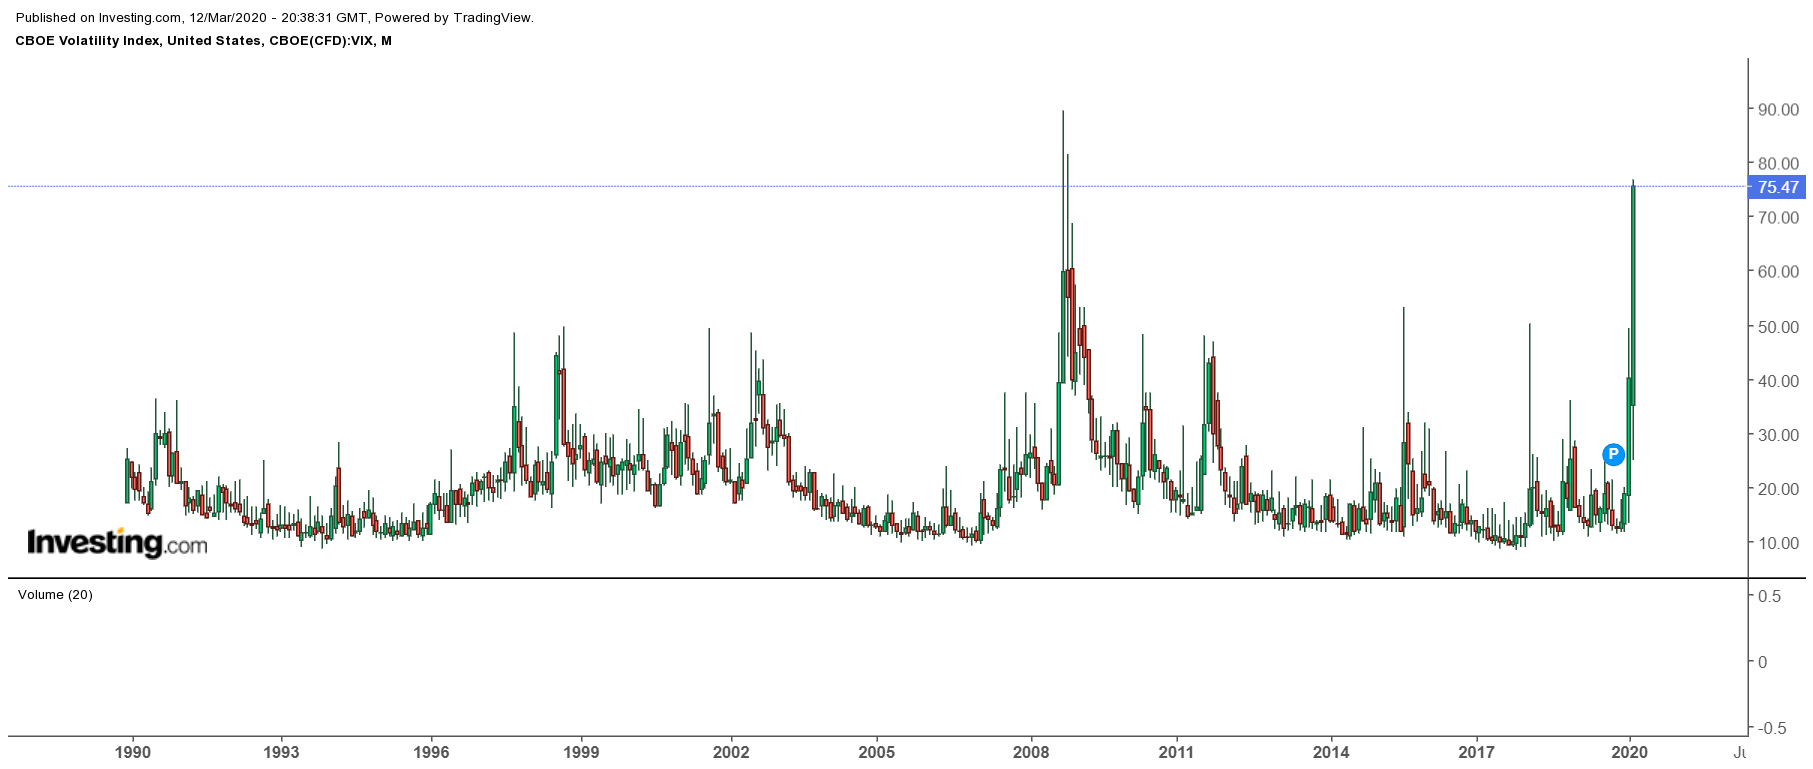
Volatility levels have surged and any hope they may subside seems to be vanishing quickly. The often followed VIX index has risen to levels not seen since the financial crisis of 2008. But another measure of volatility one can use is the width of Bollinger Bands, which have also reached levels not seen since that same time on the S&P 500.
The volatility in the market has been unprecedented due to the force and the velocity of the declines. Given these massive gyrations, it could take some time before we begin to have calm restored, and volatility to subside.

Bollinger Band Width
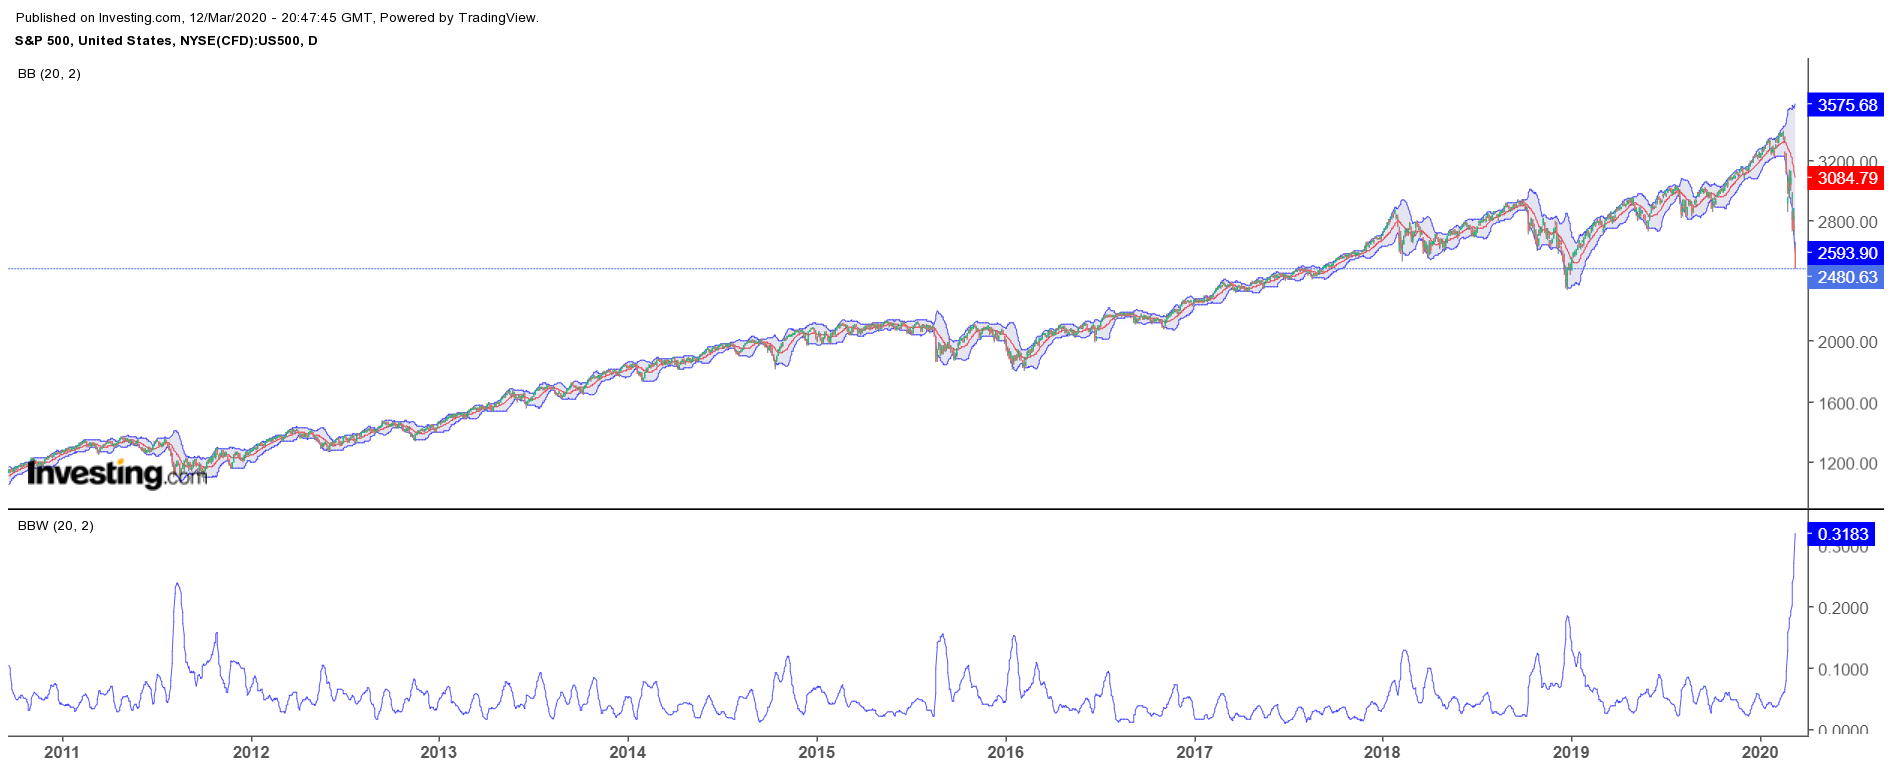
Bollinger Bands measure a two standard deviation move above or below the 20 day moving average. It creates a band around the price of a stock or an index, suggesting it may be overbought or oversold. It makes the width of those bands an indicator of how much volatility is taking place. As those bands widen, it shows a sudden and sharp move has taken place. As those bands contract, it would indicate that volatility in the market is beginning to subside.
Currently, the bandwidth has reached a level of 0.32, which is much higher than most major periods of recent volatility. The only period of volatility that saw higher readings in current times came in the fall of 2008 when it reached 0.41.

What Does It Mean For Future Volatility?
If we use prior periods of such massive amounts of volatility, we learn that it took months for volatility levels to begin to subside. For example, during the summer of 2011, the volatility surged in the summer months due to fears over the European debt crisis and the downgrade of the US debt rating. It resulted in the S&P 500 plunging by almost 21% from intraday peaks to troughs. The Bollinger bands peaked around 0.24 and then took nearly six months for volatility levels to subside.
It likely means that volatility levels are going to remain high for some time to come as the market tries to heal from the shock to its system. It probably means we can expect to see these wild price swings remain for some time even after the equity markets around the globe try to bottom, potentially for months.
Options Market
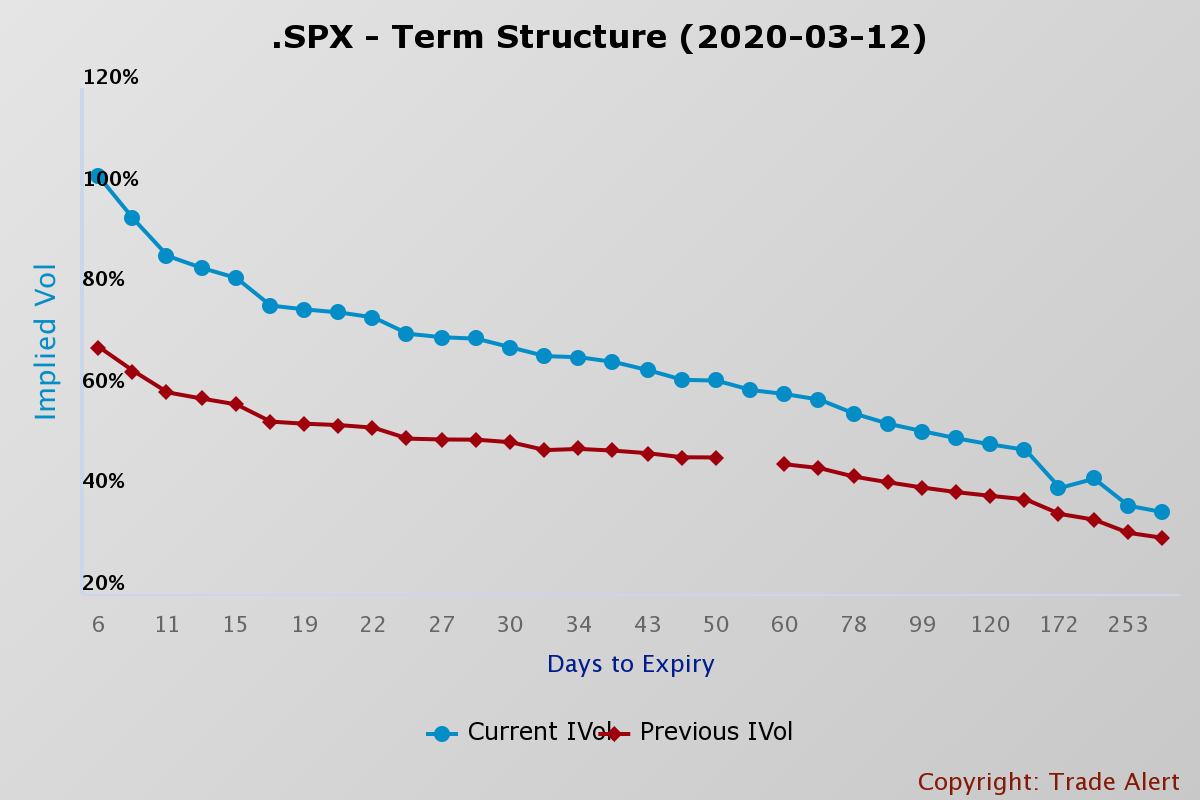
The implied volatility term structure of the S&P 500 is also extremely elevated at 102% as of March 12. But it shows that implied volatility levels are expected to be high for expiration dates for the next 2 to 3 months forward. It makes the prices even to buy options in the market elevated.

(Trade Alert)
Overall, one should expect volatility to remain very high in the weeks and months ahead, and a rebound is likely to be very choppy, resembling a period more like that of 2011, then the recovery of 2019. It would suggest that the stock market could swing between massive moves up and down during that period.
While the outlook for stocks seems uncertain, it seems clear that the volatility recently witnessed is not going to subside by much in the months ahead —even as the wild price swings begin to grow smaller.
