
Shares of Dollar General Corporation (NYSE:DG) are down roughly 6% during pre-market trading hours, following the company’s soft start to fiscal 2018. This discount retailer posted lower-than-expected first-quarter results, wherein top line missed the Zacks Consensus Estimate for the second quarter in row. Management highlighted that the company encountered with inclement weather condition during the quarter. We note that even the top and bottom line growth failed to cushion the stock. The company also kept its fiscal 2018 view intact.
Notably, in the past six months, the stock has gained 10% compared with the industry’s increase of 11%.
In the quarter under review, earnings came in at $1.36 per share falling short of the consensus mark of $1.40. However, the bottom line of this Zacks Rank #2 (Buy) stock surged 33.3% year over year, courtesy to higher net sales and share repurchase activity.
Net sales of $6,114.5 million improved 9% from the prior-year quarter but came below the Zacks Consensus Estimate of $6,189 million. Contribution from new outlets favorably impacted the top line.
Moreover, Dollar General’s comparable-store sales increased 2.1% year over year primarily owing to rise in average transaction, marginally overshadowed decrease in customer traffic. Consumables provided a boost to the comparable-store sales, while apparel, seasonal and home categories had a negative impact.
Sales in the Consumables category increased 10.6% to $4,772.4 million, while the same in Seasonal category witnessed a rise of 4.3% to $691 million. Home products sales rose 6.4% to $354.6 million, while Apparel category sales fell 0.6% to $296.4 million.
Gross profit advanced 9.6% to $1,862.2 million, while gross margin expanded 17 basis points (bps) to 30.5% owing to increased initial inventory markups, partly offset by sales from consumables that carries lower margin and higher transportation costs. Although operating income rose 3.5% to $490.2 million, operating margin contracted 43 bps to 8%.
Dollar General Corporation Price, Consensus and EPS Surprise
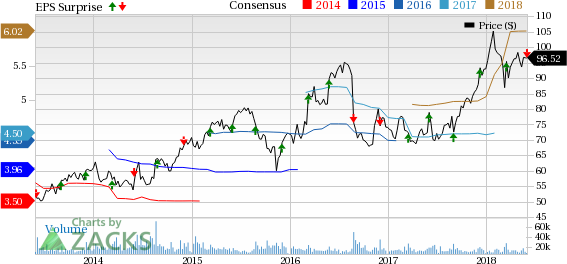
Dollar General Corporation Price, Consensus and EPS Surprise | Dollar General Corporation Quote
Stock Update
During the quarter, Dollar General opened 241 new stores, remodeled 322 stores and relocated 31 stores. The company plans to open about 900 new stores, remodel 1,000 stores and relocate 100 stores during the fiscal year.
Other Financial Details
Dollar General ended the quarter with cash and cash equivalents of $284 million, long-term obligations of $2,862.5 million and shareholders’ equity of $6,236.3 million. The company incurred capital expenditures of $165 million during the quarter. For fiscal 2018, it continues to anticipate capital expenditures in the range of $725-$800 million.
The company bought back 1.6 million shares for $150 million during the quarter. Since the commencement of the share repurchase program in December 2011, the company has bought back 83 million shares aggregating $5.3 billion. At the end of the quarter, it has an outstanding authorization of nearly $1.2 billion.
Outlook
Management continues to expect net sales growth of 9% with comparable-store sales increase in mid-two percent range during fiscal 2018. Dollar General also reiterated full year earnings in the band of $5.95-$6.15. The Zacks Consensus Estimate for fiscal 2018 is currently pegged at $6.02.
3 Hot Stocks Awaiting Your Look
Columbia Sportswear Company (NASDAQ:COLM) delivered an average positive earnings surprise of 18.1% in the trailing four quarters. It has a long-term earnings growth rate of 11.1% and sports a Zacks Rank #1 (Strong Buy). You can see the complete list of today’s Zacks #1 Rank stocks here.
Fossil Group (NASDAQ:FOSL) delivered an average positive earnings surprise of 54.1% in the trailing four quarters. It carries a Zacks Rank #2.
Steven Madden (NASDAQ:SHOO) delivered an average positive earnings surprise of 5.9% in the trailing four quarters. It has a long-term earnings growth rate of 10.7% and a Zacks Rank #2.
Will You Make a Fortune on the Shift to Electric Cars?
Here's another stock idea to consider. Much like petroleum 150 years ago, lithium power may soon shake the world, creating millionaires and reshaping geo-politics. Soon electric vehicles (EVs) may be cheaper than gas guzzlers. Some are already reaching 265 miles on a single charge.
With battery prices plummeting and charging stations set to multiply, one company stands out as the #1 stock to buy according to Zacks research.
It's not the one you think.
See This Ticker Free >>
Fossil Group, Inc. (FOSL): Free Stock Analysis Report
Dollar General Corporation (DG): Free Stock Analysis Report
Steven Madden, Ltd. (SHOO): Free Stock Analysis Report
Columbia Sportswear Company (COLM): Free Stock Analysis Report
Original post
Zacks Investment Research