
As usual, here are a few more observations from Yesterday's developments. The charts display the day's support and resistance from the daily report issued around 2am-3am GMT and last for the rest of the day.
Comments provide examples of integrating technical indicators and the implications. The dollar's bearish momentum appears to be slowing. Yesterday's price action was particularly static and lifeless. With the dollar's bullish divergences beginning to develop there could still be limited downside available to the Dollar at this point. Note the convergence of the Clouds across time frames.
These indicators and daily support and resistance are available free of charge on the fast and responsive WorldWideMarkets MT4 platform.
USD/JPY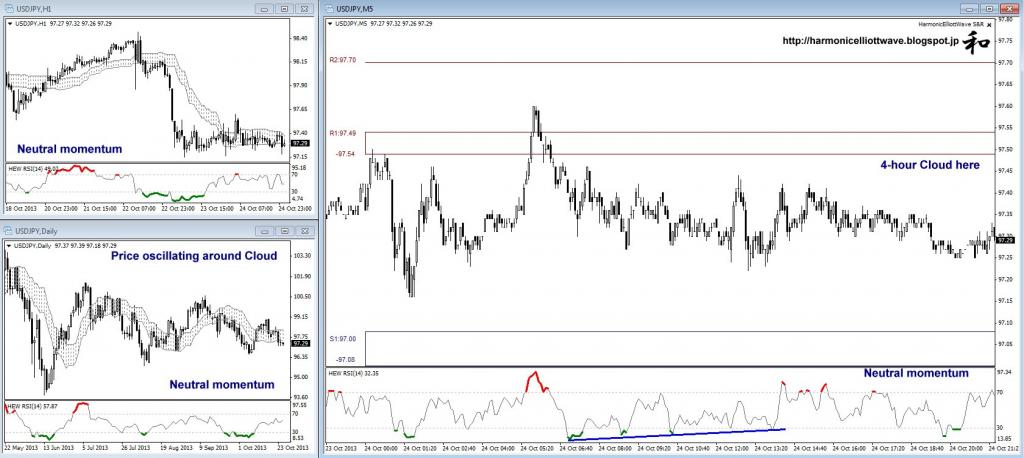 USD/JPY Hour Chart" title="USD/JPY Hour Chart" width="1024" height="459">
EUR/USD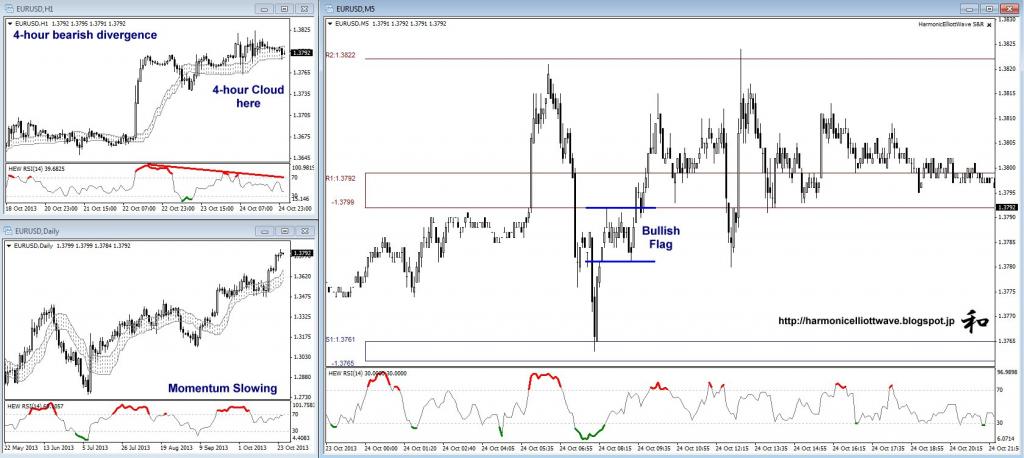 EUR/USD Hour Chart" title="EUR/USD Hour Chart" width="1024" height="459">
USD/CHF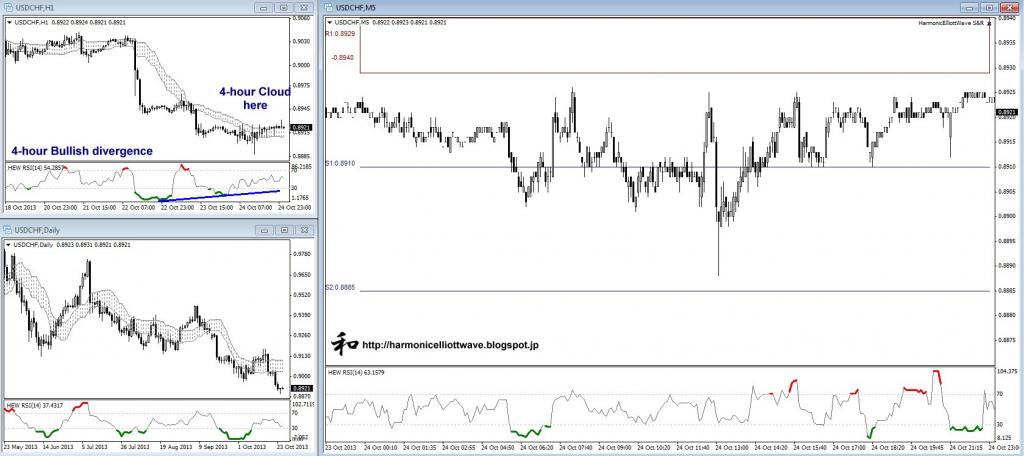 USD/CHF Hour Chart" title="USD/CHF Hour Chart" width="1024" height="459">
GBP/USD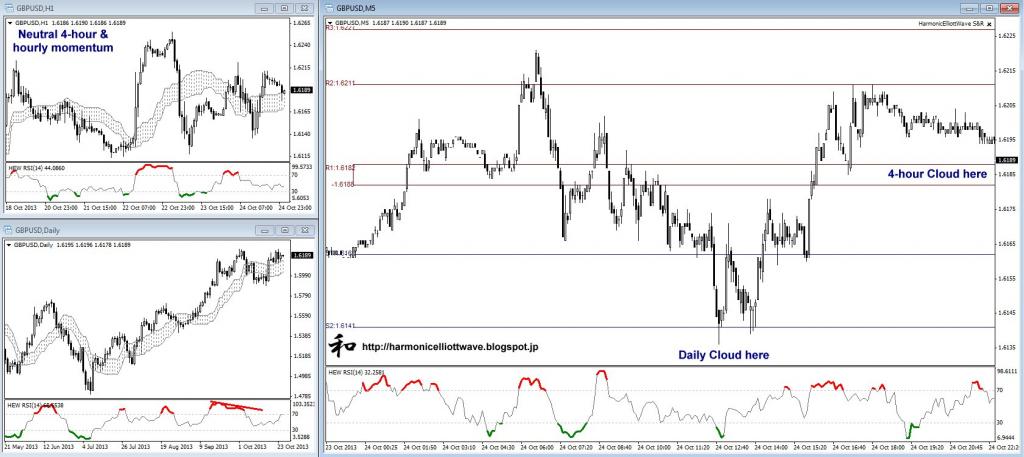 GBP/USD Hour Chart" title="GBP/USD Hour Chart" width="1024" height="459">
EUR/JPY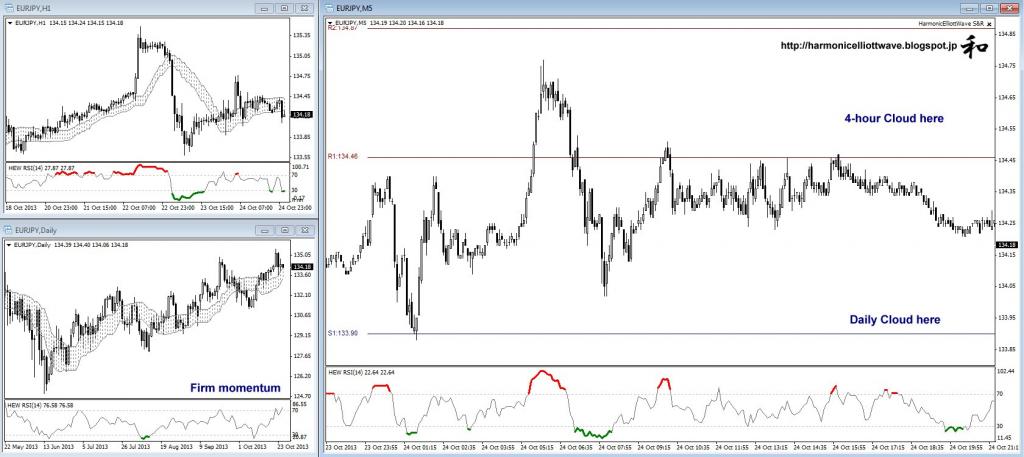 EUR/JPY Hour Chart" title="EUR/JPY Hour Chart" width="1024" height="459">
AUD/USD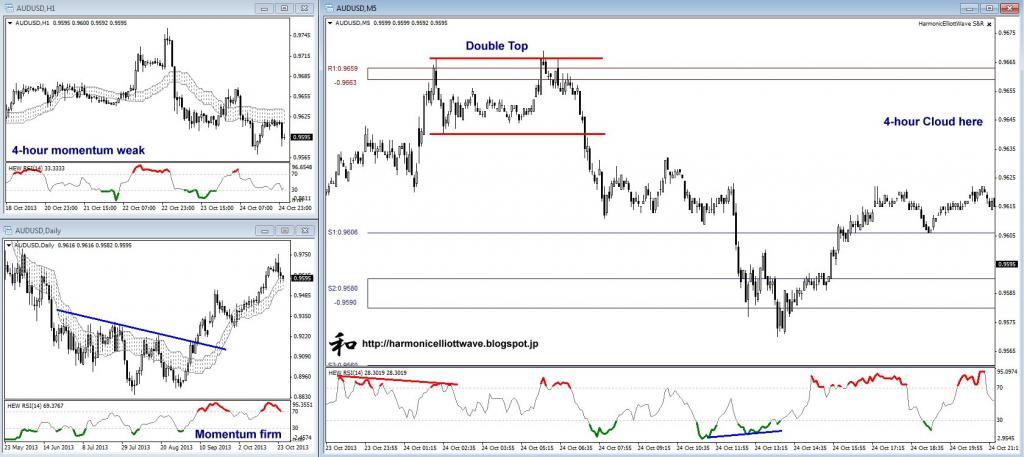 AUD/USD Hour Chart" title="AUD/USD Hour Chart" width="1024" height="459">