The Dogs of the Dow strategy is one where investors select the ten stocks that have the highest dividend yield from the stocks in the Dow Jones Industrial Index (DJIA) after the close of business on the last trading day of the year. Once the ten stocks are determined, an investor invests an equal dollar amount in each of the ten stocks and holds them for the entire next year. The popularity of the strategy is its singular focus on dividend yield.
As we noted in a year end post, the Dogs of the Dow strategy in 2016 did outperform both the S&P 500 Index and the Dow Jones Industrial Average Index last year. However, the strategy is somewhat mixed from year to year in terms of outperforming the Dow index though. Over the last ten years, the Dogs of the Dow strategy has outperformed the Dow index in six of those ten years. For investors utilizing the strategy it is important to be aware of where ones bets are in terms of stock and sector exposure.
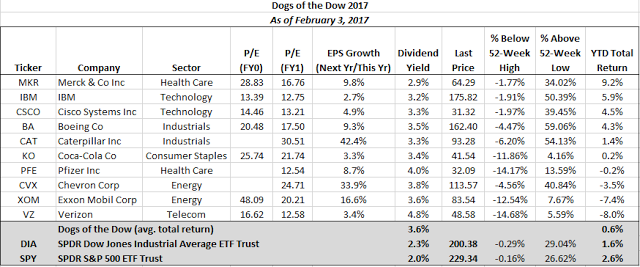
Essentially one months has passed in 2017 and the Dogs of the Dow strategy is underperforming both the Dow index and the S&P 500 Index. Below is a table noting the year to date performance of the current Dogs. 
In evaluating the performance difference, investors will note the largest detractor from performance is related to the energy sector. The 2017 Dow Dogs contain two energy stocks, Exxon Mobil (NYSE:XOM) and Chevron (NYSE:CVX). In 2016 the energy sector was the best performing sector in the S&P 500 Index, up 28%. To date in 2017, for the S&P 500 Index, energy is the second worst performing sector, down 2.5%, followed by telecom stocks which are down 3.3%.
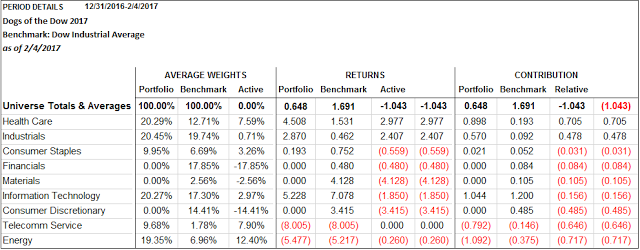
The below table details the attribution analysis of the Dow Dogs to the Dow Jones Industrial Average Index itself. As one can see, the Dogs of the Dow strategy is overweight to the energy and telecom sectors, thus, detracting from the strategy's year to date performance. Also of note is the absence of holdings in the Financial, Materials and Consumer Discretionary sectors. In comparison to the S&P 500 Index, the Dogs, and the Dow index itself for that matter, do not contain positions in utilities or REITs. 
For investors then, if the Dogs of the Dow strategy is one being pursued, it is beneficial to know where the strategy's bets are in terms of stocks and sectors. As noted previously, the Dow Dogs contain no materials stock positions and this sector is the second best performing sector in the Dow Index and the S&P 500 Index. Also, if one believes financial stocks can continue to perform well this year, the Dow Dog strategy is absent any financial positions. At the end of the day, investors will benefit knowing what they own and the economic exposure of these holdings.
