
On March 12, 2019, a rapid price increase took Dogecoin (DOGE) to near $0.00212. Subsequently, a drop commenced which saw DOGE lose a significant amount of its gains. However, DOGE is still trading above the previous resistance levels.
In our Mar 8 price analysis, we predicted that the price of DOGE would face price losses for a short period before experiencing rises. A price drop did occur with DOGE touching the support line as predicted on Mar 12. The second half of the prediction was subsequently validated with the price spike initiated on the same day support was touched.
Based on today’s analysis, we believe that the price will create new resistance and support areas at a level higher than the previous resistance.
Key Highlights For March 13
- The price broke out of the horizontal channel on Mar 12.
- The MACD and SMAs triggered a buy signal.
- The signal preceded the breakout from the channel.
- There is resistance near $0.00213.
- There is support near $0.00187.
Tracing Support
The price of Dogecoin on Hitbtc is analyzed at one-hour intervals from Feb 24 to Mar 12.
The price made a Feb 27 low of $0.001918. By Mar 12, it had revisited this price four more times. Tracing these lows gives us a horizontal support line.
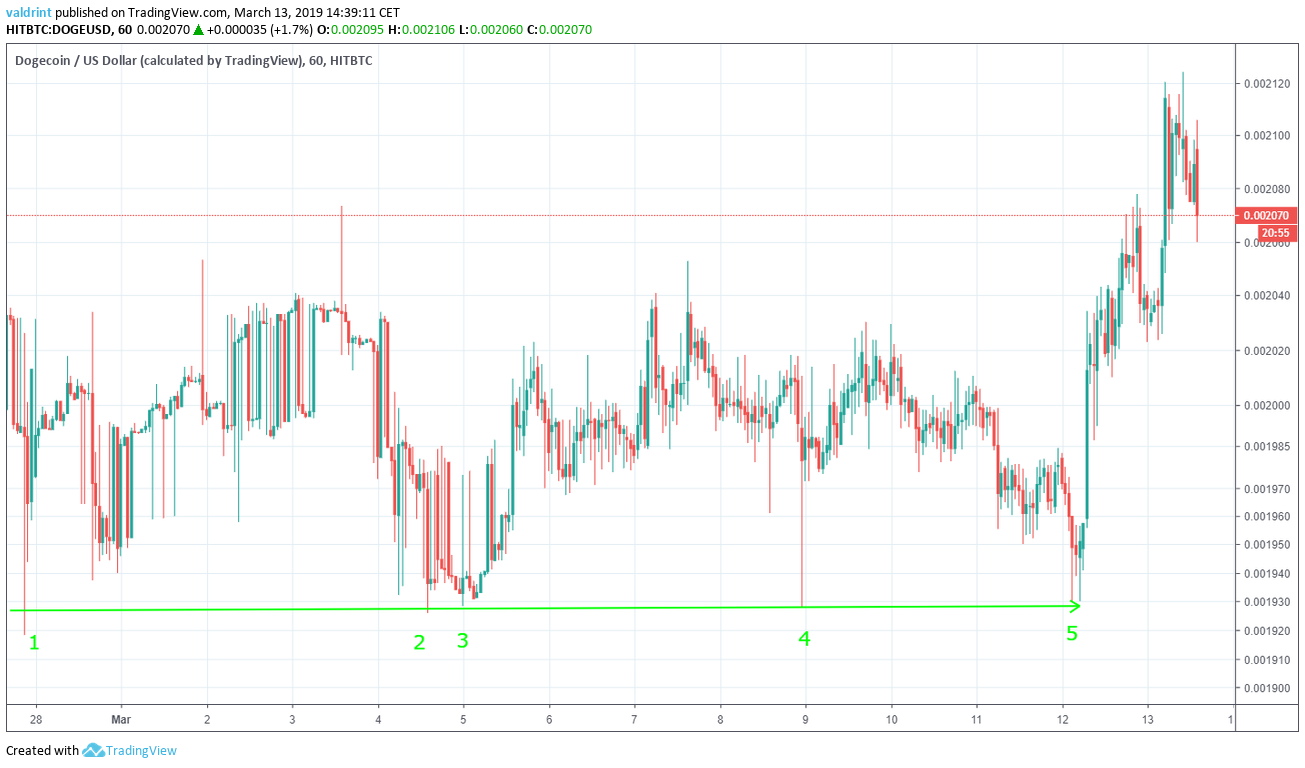
The support line acts as a floor to price—theoritically tracing the projects lows for a given period. Price should not drop below this line. DOGE has consistently traded above this line since late Feb with recent price spike bringing the value to new highs.
If price stabilizes at the new high, it is unlikely to return to the support line traced between Feb 28 and Mar 12. On the contrary, a new support line—likely moving in an upward direction—will emerge.
Horizontal Channel
The price reached a Feb 27 high of $0.002045. Since then, it has revisited the same level five other times. Tracing these highs gives us a horizontal resistance line.
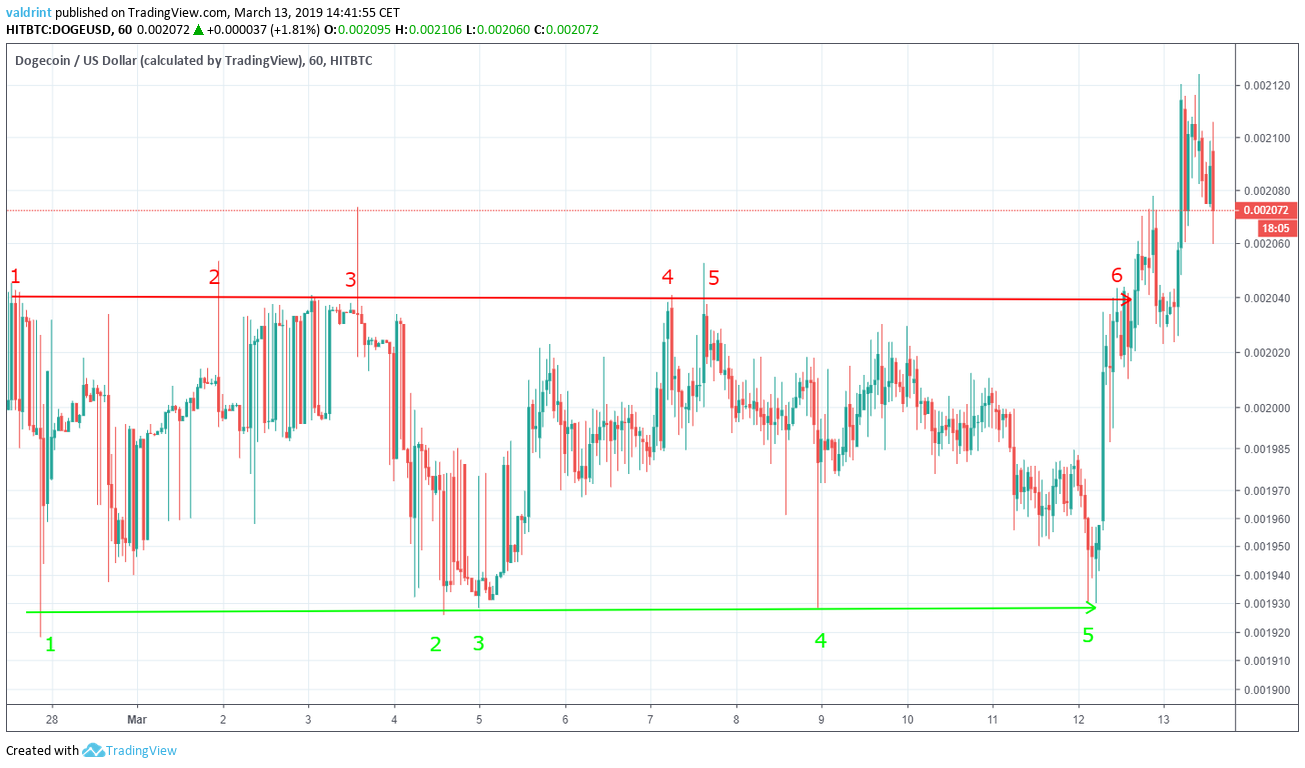
The resistance line an act as a ceiling to price similarly to the way support acts as a floor. It theoretically traces the upper limits of the price over a period of time. A breakout above resistance could trigger rapid price increases.
On Mar 12, DOGE broke out of the resistance. Despite losses on Mar 13, it continues trading well above this level. While the support and resistance lines combine to create a horizontal channel—a neutral trading pattern—price gains above the resistance suggest an emerging upward trend.
While the price may fall to lower levels, at the current price, it is likely to remain above the resistance and outside of the currently traced horizontal channel. New resistance and support lines arelikelyy emerging.
Start of an Uptrend
The moving average convergence divergence (MACD) is a trend indicator that shows the relationship between two moving averages (long and short-term) and the price. It is used to measure the strength of a move.
Combined with simple moving averages (SMA), MACD can be used as a trigger for buy and sell signals. Signals are triggered whenever the MACD line is above 0 and the price is above the 21 (red) and 50-period (green) SMAs.
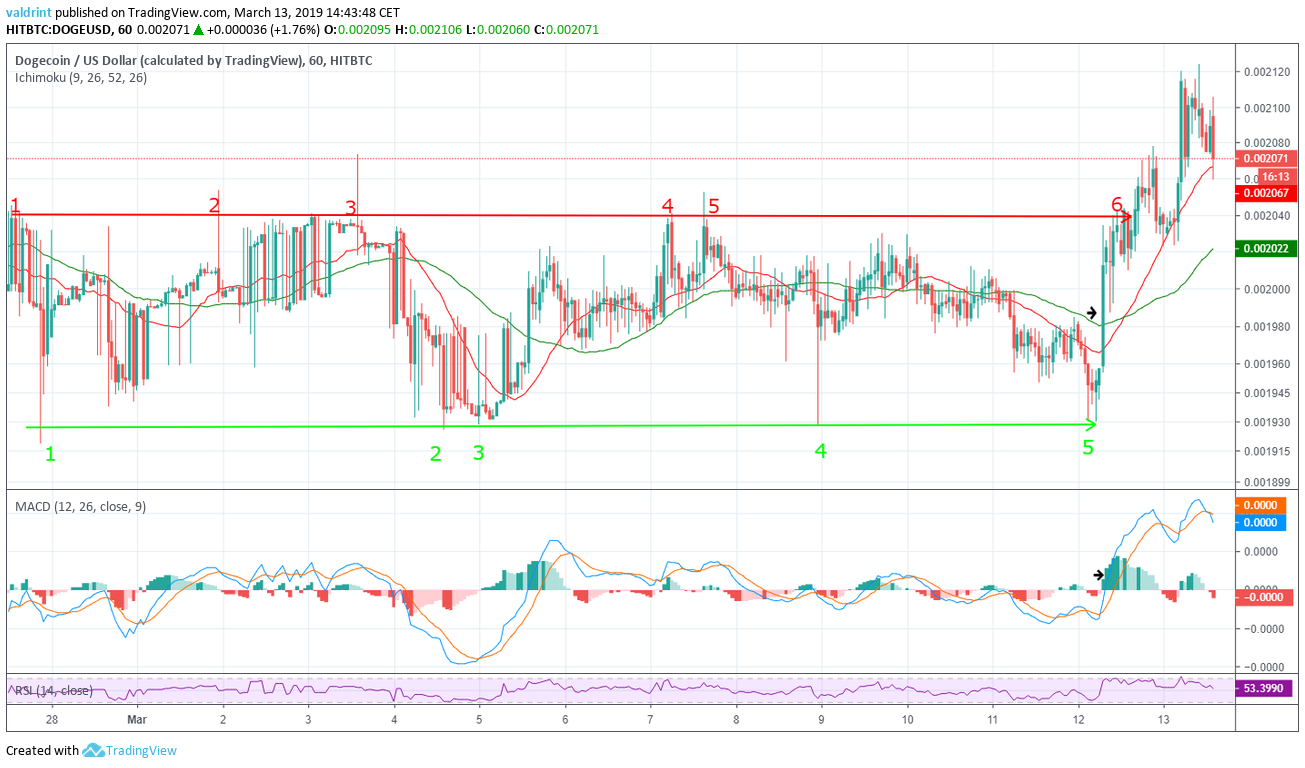
On Mar 12, the price reached a low of $0.01931. A rapid price increase ensued, which took the price above the 21 and 50-period moving averages.
During the same interval, the MACD line crossed above 0. This would have triggered a buy signal, indicating that a new uptrend may be starting and higher prices are to be expected in the future.
Using these indicators, it appears that a new uptrend has already begun.
New Resistance.
The price of Dogecoin on Hitbtc is analyzed at two-hour intervals from Jan 28 to Mar 13 in order to better visualize possible reversal areas.
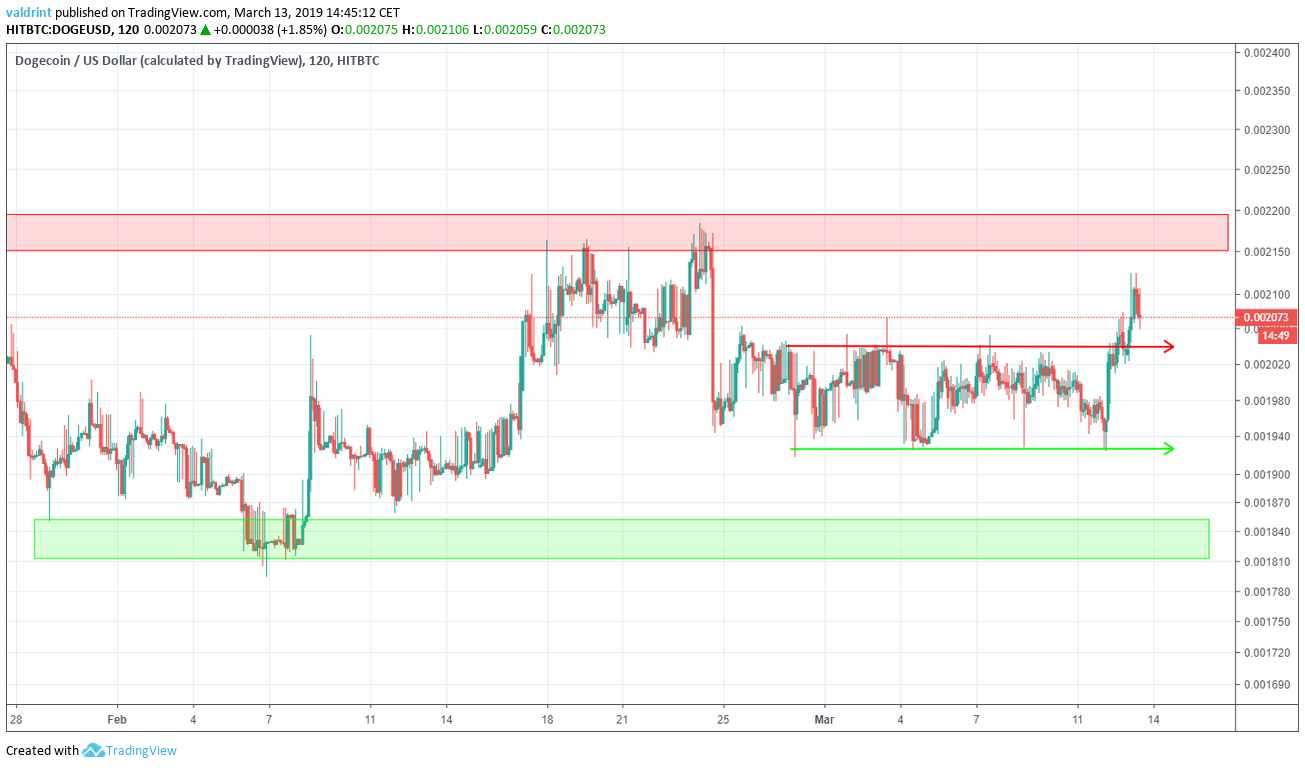
Resistance and support areas are formed when the price reaches a certain level several times. They can act as a ceiling/floor that prevents the price from moving further in that direction.
The first resistance area is found near $0.00218. This is a likely place for a reversal and a possible future resistance line.
The closest support area is found near $0.00182. We believe it is unlikely that the price reaches this area in the near future as it would demand a significant price drop, and we are prediciting that a new uptrend has already begun.
Summary of Analysis
Based on this analysis, it is likely that the price of DOGE creates new support and resistance areas between $0.00204 and $0.00218. While it is possible that the price falls back to the horizontal channel, we believe this to be an unlikely scenario. If the price drops to the previous resistance line at $0.00204 and then starts an upward move, these predictions will be fully validated.
Disclaimer: This article is not trading advice and should not be construed as such. Always consult a trained financial professional before investing in cryptocurrencies, as the market is particularly volatile.