The broadest definition of a bear market? Stocks descend 20% (rounding up) on a closing-price basis without an intervening bull market (20%) rally. Since 1929, there have been 25 S&P 500 bears with an average top-to-bottom return of -35%.
Some analysts prefer to exclude the Great Depression. (Should they?) Since World War II, the average bearish demise has been -30%.

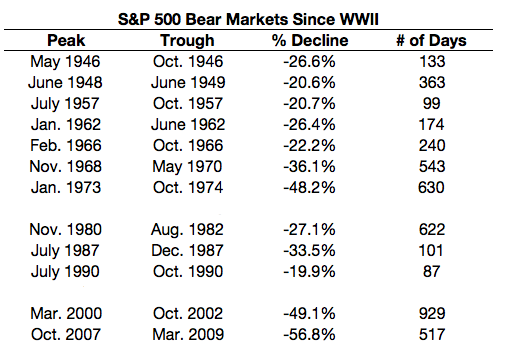
A quick perusal of the percentage losses reveals a curious truth. The last two bears? The “tech wreck” and the “financial collapse?” The price devastation in each of these crises was worse than any of the prior 10 occurrences.
For many investors, this reality provides a great deal of comfort. Surely we will not see stocks experience a third consecutive beating in the neighborhood of 50%. These had to be once-in-a-lifetime events that just happened to transpire in back-to-back fashion. Right?
Okay, then. Let’s examine the 10 bear markets between 1946 and 1990. Here we discover that a bearish event typically came to fruition within a 4-5 year period. The average fall from grace? 28%.
In other words, even if we ignore data going back to 1870, even if we disregard anything that has transpired since 1990, even if we confine our recognition of market meltdowns to a 45-year span since the end of the last world war, investors should recognize the probability of -28% from the top. At current price levels, the S&P 500 would fall to the 1650-1660 range.
If we return to the broader picture with 25 bearish events since 1929, losses of 35% would take the S&P 500 down to the 1500 marker. Would an investor with $500,000 at risk feel a whole lot better seeing an account drop to $360,000 at 1650 on the S&P 500, rather than witnessing an account value of $325,000 at 1500 for the popular index? Perhaps. Yet either potential result would be difficult pills to swallow.
Now let’s consider a completely different plausibility. The last two bear markets – 50% price plunges that we tether to 2000 and 2008 respectively – were larger than normal because of irresponsible central bank policy. In particular, ever since Alan Greenspan took charge of the Federal Reserve three decades ago, the Fed has “stimulated” the American economy with lower and lower borrowing costs. Households/businesses responded to lower borrowing by gobbling up stocks, real estate and other risk assets. Bubbles formed. And in the last two instances, those bubbles popped.
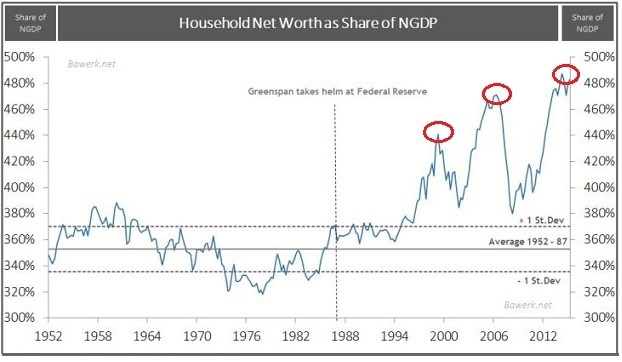
Take a look a household net worth as a percentage of the economy (GDP). Shortly after World War II up through the first half of the 1980s, the Federal Reserve did not goose the economy through unimaginably low overnight lending rates. Household Net Worth-to-GDP remained relatively stable for three decades.

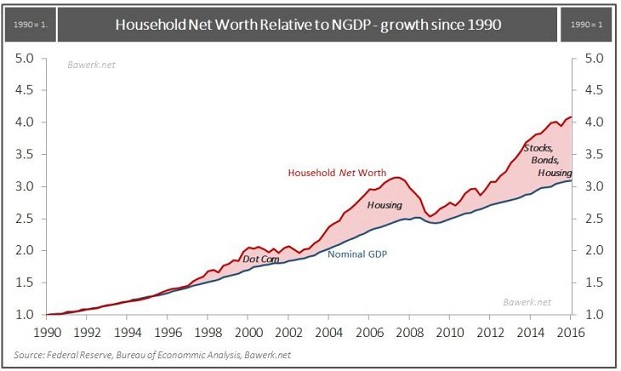
With the Greenspan/Bernanke/Yellen Fed of the next three decades, however, Household Net Worth-to-GDP has been on a roller coaster ride. It rocketed in the 1990s on relatively cheap credit, only to plummet in the dot-com disaster. Even cheaper credit launched the housing boom, only to see real estate riches go up the chimney in smoke during the subprime nightmare.
And now, everything outside of commodities – stocks, bonds, real estate – has been inflated with the aid of eight years of central bank-manipulated interest rates. Is it sensible to believe that Household Net Worth to GDP will remain in the stratosphere? (See the chart above.) Or is it reasonable to anticipate that Household Net Worth will revert back to the growth rate of the economy? (See the chart below.)

If we assume the latter, one or more of the over-inflated asset classes will drop dramatically. From my vantage point, stocks may suffer the most.
Interestingly enough, stock investor bullishness has not been this high since 2004. Meanwhile, stock volatility has rarely been this placid. It has been 36 days without a 1% intra-day price swing. And the last time the S&P 500 traded 80-plus sessions without a 1% decline? At the height of home price euphoria in 2006.
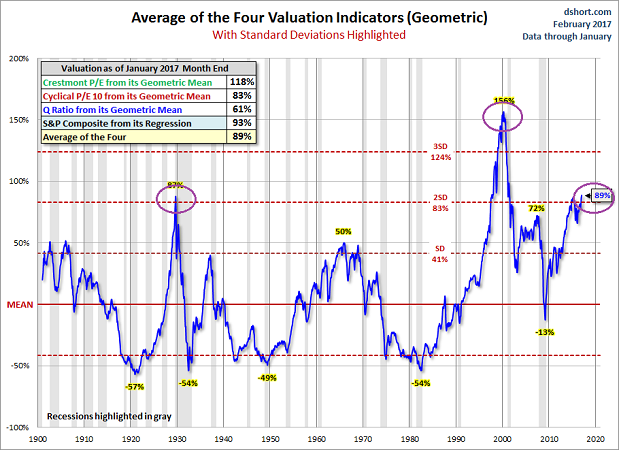
Stock investors show little fear. Not about the potential for higher borrowing costs or tighter restrictions on access to credit itself. Not about significant indications of economic slowdown. No concern about exorbitant valuations either — valuations that are as high as 1929 and surpassed only by the tech bubble in 2000.

In previous articles, I have addressed the length of the bull market runs themselves. Invariably, naysayers will counter that “bull markets do not die of old age.” Maybe not. Nevertheless, the longest bull market in history (10/1990-3/2000) at nine years and five months finished with the S&P 500’s devastating -49.1% bearish retreat. (The NASDAQ logged -76%.) The second longest (8/1921-9/1929) at eight years and one month witnessed near-total Dow devastation (-86%). Is it really the case that we should pay zero attention to today’s third longest bull run (7 years, 11 months)? Or should one consider the exorbitant price premiums investors were paying at the end of the bullish stretches in 1929 and 2000, since valuations are currently two standard deviations above a geometric mean here in 2017?
Run for the hills? Exit stage left? That’s your decision. I’ve already raised cash/cash equivalents to 25% or more for the bulk of growth-and-income clients.
That said, I will leave readers with this: Back in 2010, an investor’s equity risk premium for choosing stocks over the risk-free rate of 10-year U.S. Treasuries clocked in around 4.25%-4.5%. With the S&P 500’s E/P of 3.85% and the 10-year’s 2.35%, the excess return for investing in the stock market over the risk-free rate of government Treasuries is a scant 1.5%. Just 1.5%! Somewhere Dirty Harry is uttering, “Do I feel lucky? Well, do ya, punk?”
Disclosure: Gary Gordon, MS, CFP is the president of Pacific Park Financial, Inc., a Registered Investment Adviser with the SEC. Gary Gordon, Pacific Park Financial, Inc, and/or its clients June hold positions in the ETFs, mutual funds, and/or any investment asset mentioned above. The commentary does not constitute individualized investment advice. The opinions offered herein are not personalized recommendations to buy, sell or hold securities. At times, issuers of exchange-traded products compensate Pacific Park Financial, Inc. or its subsidiaries for advertising at the ETF Expert web site. ETF Expert content is created independently of any advertising relationships.
