Get 40% Off
🔥 This hedge fund gained 26.16% in the last month. Get their top stocks with our free stock ideas tool.See stock ideas

Did The CRB Bottom?

Published 09/11/2018, 02:04 PM
Updated 07/09/2023, 06:31 AM
DX
-
TRCCRBTR
-

CRB Index

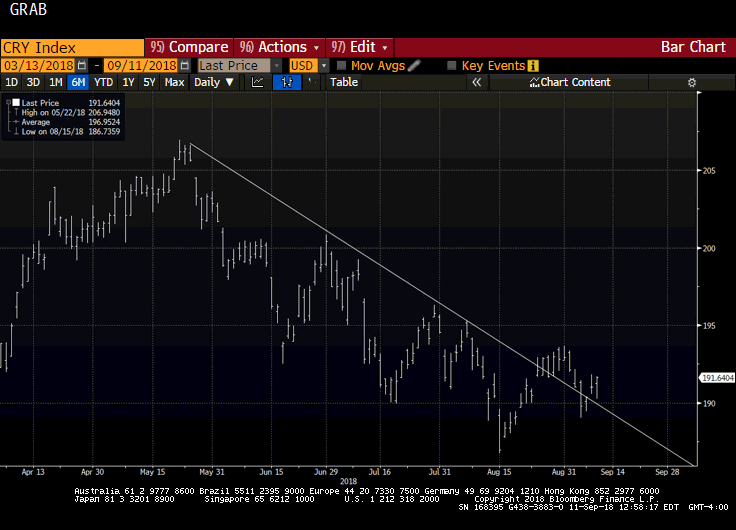
The CRB Index has been trending lower since late May. It fell nearly 10% to retrace 50% of the rally from June 2017. This Great Graphic shows the 4 1/2 month trendline. It had been violated in late August but fell back under it at the end of last week.

On Monday, it gapped higher, above the trendline. On Tuesday it filled the gap and rallied to new session highs. A move above 192.00 would likely confirm a bottom of some importance is in place. The technical readings on the weekly bar charts are more constructive than the dailies.

The commodities in the basket are mostly traded in US dollars. Typically, then when the dollar is strong, one generally expects lower commodity prices and vice versa. On a purely directional basis, the CRB Index and the Dollar Index have an inverse correlation of -0.65 over the past 60 days. Since 2016, the inverse correlation has rarely been stronger. This would suggest that the next move may have a weaker inverse correlation. That is to say that a favorable near-term technical outlook for the CRB Index may not have significant implications for the Dollar Index, even if there is a small negative bias.

Original Post

Latest comments

Risk Disclosure: Trading in financial instruments and/or cryptocurrencies involves high risks including the risk of losing some, or all, of your investment amount, and may not be suitable for all investors. Prices of cryptocurrencies are extremely volatile and may be affected by external factors such as financial, regulatory or political events. Trading on margin increases the financial risks.
Before deciding to trade in financial instrument or cryptocurrencies you should be fully informed of the risks and costs associated with trading the financial markets, carefully consider your investment objectives, level of experience, and risk appetite, and seek professional advice where needed.
Fusion Media would like to remind you that the data contained in this website is not necessarily real-time nor accurate. The data and prices on the website are not necessarily provided by any market or exchange, but may be provided by market makers, and so prices may not be accurate and may differ from the actual price at any given market, meaning prices are indicative and not appropriate for trading purposes. Fusion Media and any provider of the data contained in this website will not accept liability for any loss or damage as a result of your trading, or your reliance on the information contained within this website.
It is prohibited to use, store, reproduce, display, modify, transmit or distribute the data contained in this website without the explicit prior written permission of Fusion Media and/or the data provider. All intellectual property rights are reserved by the providers and/or the exchange providing the data contained in this website.
Fusion Media may be compensated by the advertisers that appear on the website, based on your interaction with the advertisements or advertisers.
© 2007-2024 - Fusion Media Limited. All Rights Reserved.