
Between Mar 4 and 5, 2019, the price of Binance Coin (BNB) jumped from under $12 to nearly $16. Since Mar 6, a slight reversal has taken place. While BNB is currently trading at significantly higher levels than Mar 4, it has dropped from the highs experienced on Mar 5.
On Mar 9, CEO of Binance Changpeng Zhao announced that the company might open a fiat-to-crypto exchange based in Argentina. As plans for growth continue, will the price of BNB be able to reach higher highs or will price decreases continue?
Key Highlights For March 11
- The price of Binance Coin (BNB) has been on a downward trend since Mar 7.
- It is currently trading inside a symmetrical triangle.
- The MACD and SMAs have triggered a sell signal, indicating a future downtrend.
- There are support areas $11.1 and $9.8.
- There is resistance near $15.5.
Descending Resistance Line
The price of BNB on Binance is analyzed at 30-minute intervals from Mar 6 to Mar 11.
The price reached a high of $15.85 on Mar 7. It has made lower highs since. Tracing these highs gives us a descending resistance line.
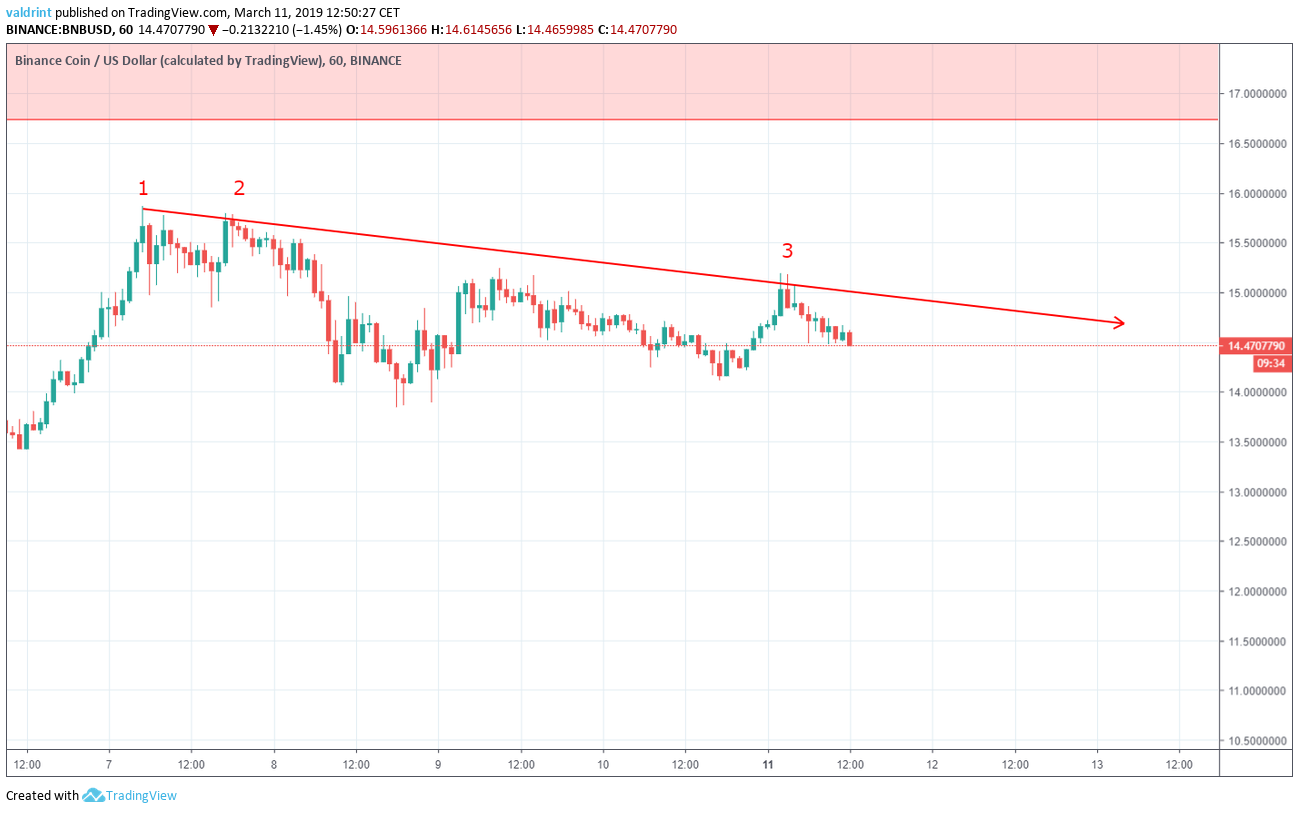
The dates on which the line was touched are Mar 7 (twice) and Mar 11.
The resistance line can act as a ceiling to price. Theoretically, it predicts the upper limits of price over a period of time. However, the price might decrease at a rate faster than the resistance line. If the price exceeds the resistance for a sustained period, a rapid price increase might ensue.
The current downtrend may be a market response to the rapid upward move from Mar 4 to Mar 8, and it may continue into the foreseeable future. It may not mark significant price losses are not expected. The exact span of time they might occur cannot be predicted by this line alone.
Ascending Support Line
After the second Mar 7 high, a rapid drop ensued.
The price made a bottom of $13.848 on Mar 9. It has made successive lower highs since. Tracing these highs gives us the support line.
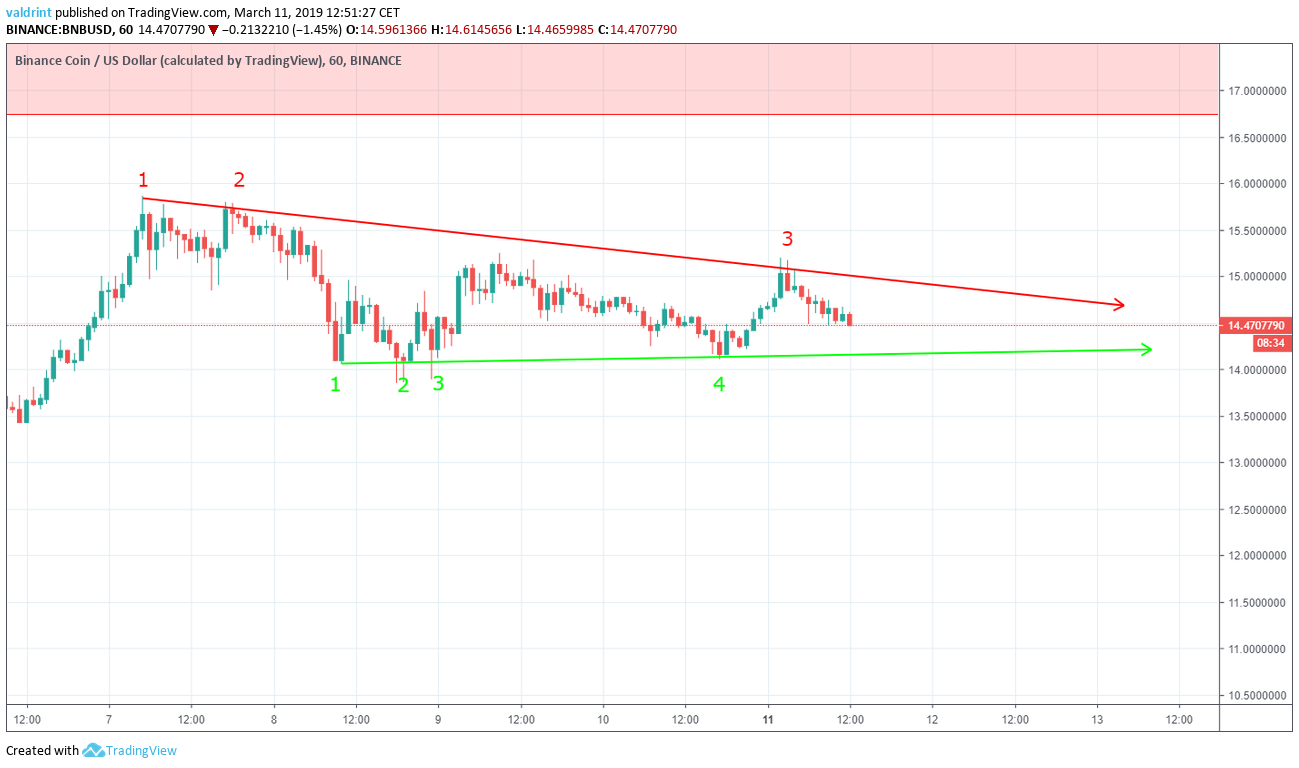
The dates on which the line was touched are Mar 8 (twice), Mar 9, and Mar 10.
The support line can act as a floor to price in the way the resistance line acts as a floor. Support predicts the lower limits of price over a certain period of time. In the case of BNB, the support line is nearly horizontal.
The resistance and support lines combine to create a symmetrical triangle, which is a neutral pattern, making price increases and decreases equally likely.
As prices continue to decrease, the price of BNB may continue trading within this triangle. If so, it will be forced to break out of the resistance or break down from the support.
Given that there is a current downward trend, it is more likely that XRP will breakdown from the support.
However, a breakout may occur at the point of convergence. A breakdown could subsequently follow. At the same time, BNB might continue trading along the support line finding an average price level that is higher than pre-Mar 4 level.
Signal Triggered
To better predict future possible price fluctuations, the moving average convergence divergence (MACD) is combined with SMA (SMA). They are used together to assess whether buy or sell signals have been triggered. Combined with simple moving averages (SMA), MACD can be used as a trigger for buy and sell signals.
Signals are triggered whenever the MACD line is above 0 and the price is above the 21 (red) and 50-period (green) SMAs.
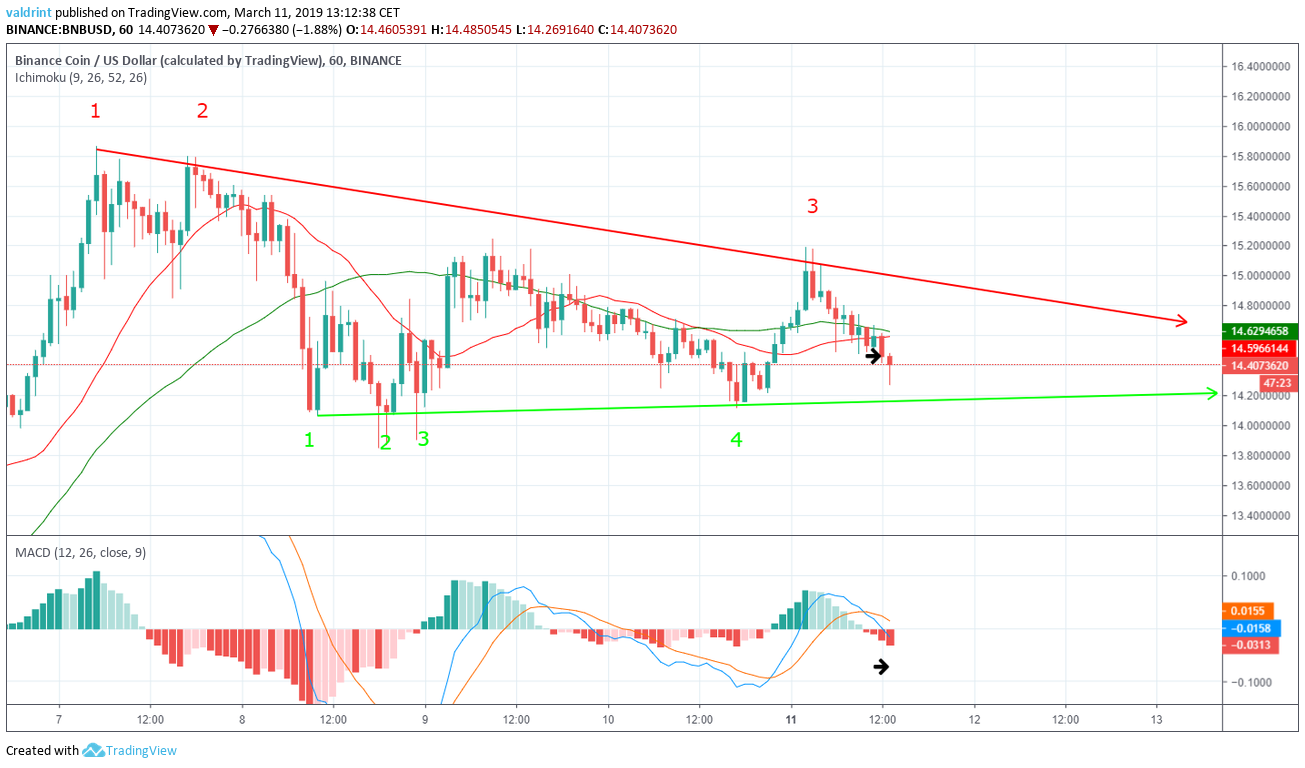
Since reaching the Mar 11 high of $15.19, a gradual drop ensued. Price moved below the 21 and 50-period moving averages. Similarly, the MACD line moved below 0.
This would effectively trigger a sell signal, indicating that a downtrend may begin and lower future prices are in store.
Support and Resistance
The price of BNB on Binance is analyzed at six-hour intervals from Feb 1 to Mar 11.
Resistance and support areas are formed when the price reaches a certain level several times. They can act as a ceiling/floor that prevents the price from moving further in that direction.
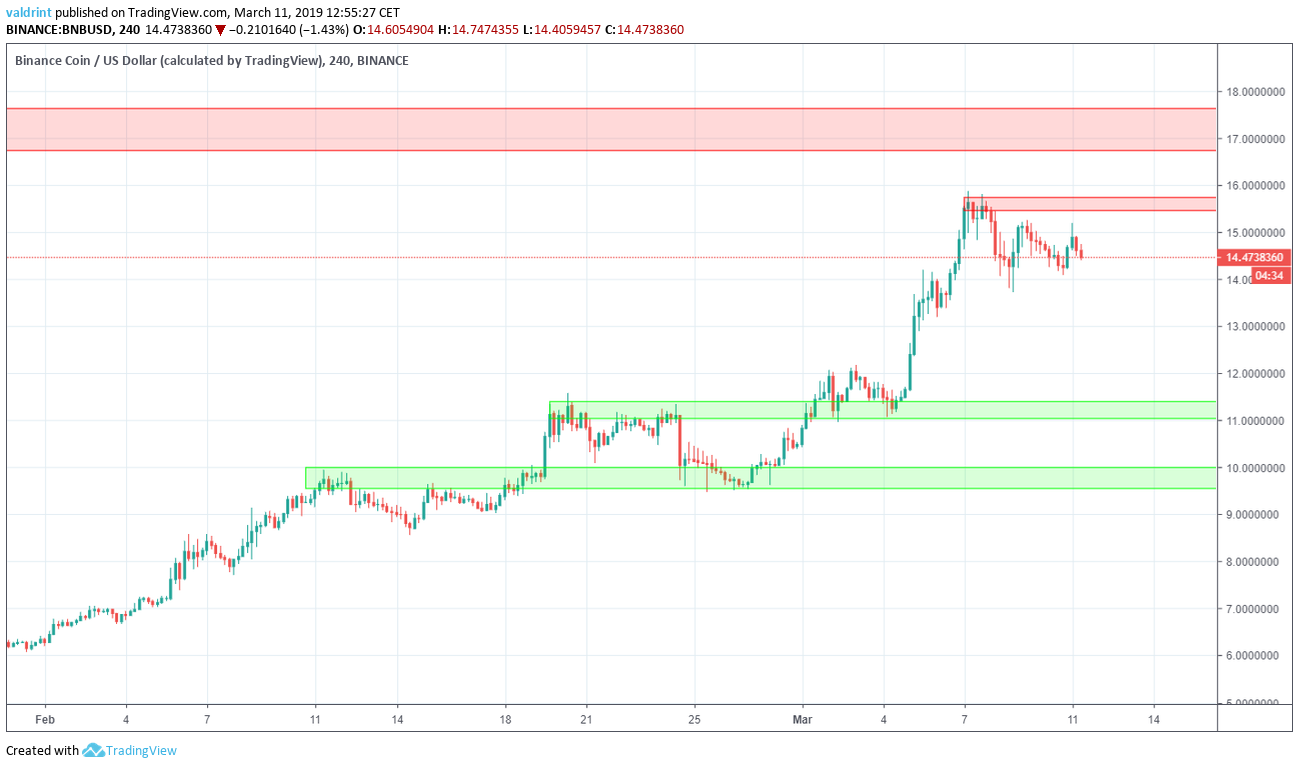
The closest resistance area is found near the Mar 7 highs near $15.8. If a breakout were to occur, this would be a likely reversal area.
Conversely, the closest support areas are found near $11.1 and $9.8. Price is likely to visit these areas if a breakdown occurs. A bounce-back is to be expected before price reaches these levels.
Summary of Analysis
Based on this analysis, a movement inside the triangle is likely before a breakdown occurs—which is projected to occur this week. Subsequent price fluctuations may be affected by qualitative factors such as Binance’s expansion into new nation-states and geographical territories.
If the price trades inside the triangle and stays close to the support line, the prediction will be partially validated. If it breaks down from it, it will be fully validated.
Disclaimer: This article is not trading advice and should not be construed as such. Always consult a trained financial professional before investing in cryptocurrencies, as the market is particularly volatile.