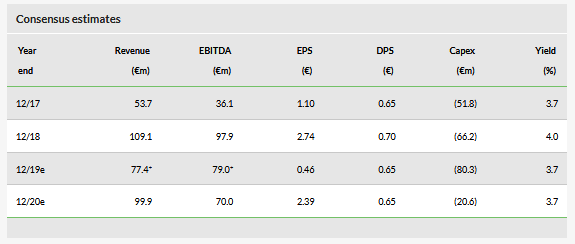
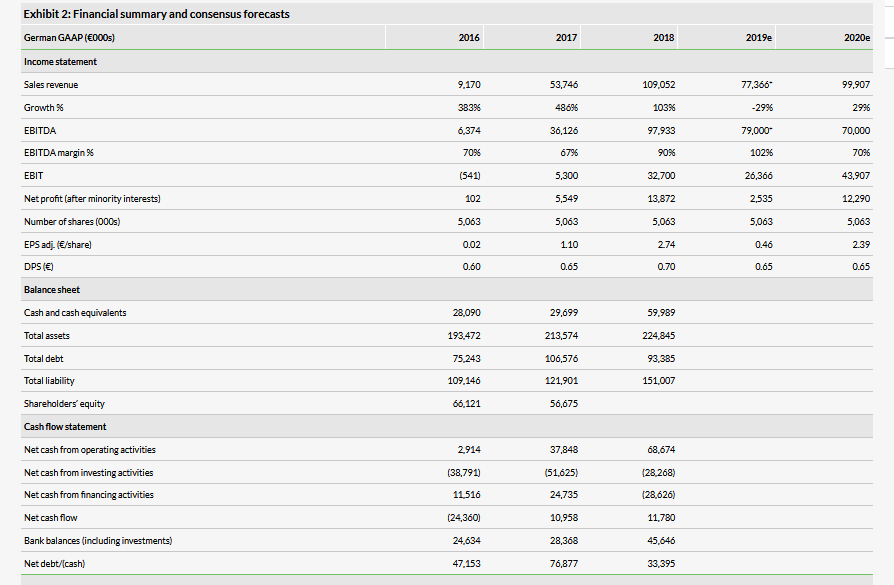
Deutsche Rohstoff AG (DE:DR0G) organic investments, c $145m in FY17 and FY18, helped deliver more than 100% growth in FY18 revenues to €109.1m (€53.7m in FY17). Year-on-year sales growth was supported by a material increase in oil and gas production, which almost doubled to 9.4kboed (from 5.1kboed in FY17), combined with higher price realisations. EBITDA rose more than 250% to €97.9m (€36.1m in FY17), while net income (after minority interests) rose to €13.9m (€7.7m in FY17). DRAG’s key focus remains on its US oil and gas interests, with c $70m of organic and internally funded investment planned in 2019. As a result, DRAG guides to EBITDA in the €25–35m range in FY19 and €55–65m in FY20, reflecting recent divestments and underlying growth from Cub Creek Energy.
Organic investment and asset monetisation
FY18 was marked by organic investment in development well locations and the sale of the bulk of the Salt Creek Oil & Gas asset base in North Dakota. Organic investment is to continue in FY19 with c $70m planned in DRAG’s US subsidiaries, and c $60m of the total being invested in Cub Creek Energy well locations. Management’s EBITDA guidance for FY19 is based solely on current production and for FY20 on expected growth driven by investment in Cub Creek based on a $58/bbl WTI and $2.75/mcf price deck. Guidance excludes acquisitions or asset divestments, both of which remain a key component of DRAG’s strategy.
Metals positive value development expected in FY19
DRAG’s metals division reported a loss in FY18 due to asset write-downs at Hammer Metals and Devonian Metals. However, management sees a point of inflexion with Almonty Industries, DRAG’s most material metals investment, generating a profit in Q119, and nearing Sangdong mine financing.
Valuation: Below audited 1P and 2P reserve values
DRAG’s most recent independent 1P and 2P valuation of its oil and gas assets totals €186.3m, including Elster Oil & Gas, Cub Creek Energy, Salt Creek Oil & Gas and the new subsidiary Bright Rock Energy. We assume the company’s mining assets are valued at book value, adding in end-2018 net debt. This amounts to a SOTP valuation of c €119.4m or €23.6/share, rising to €24.9/share including 2P reserves. DRAG currently trades at a 35% discount to its 1P reserve value and a 43% discount to its 2P reserve value on this basis.


Business description
Deutsche Rohstoff identifies, develops and monetises resource projects in North America, Australia and Europe. The company’s focus is on the development of oil and gas opportunities in the US.
Bull
Track record of value creation.
Acquisition opportunities US onshore.
Technology driving increased US returns.
Bear
Diverse commodity focus for a small company.
Disparate US peer group.
High operational leverage if oil prices fall.
FY18: Asset monetisation and production increase
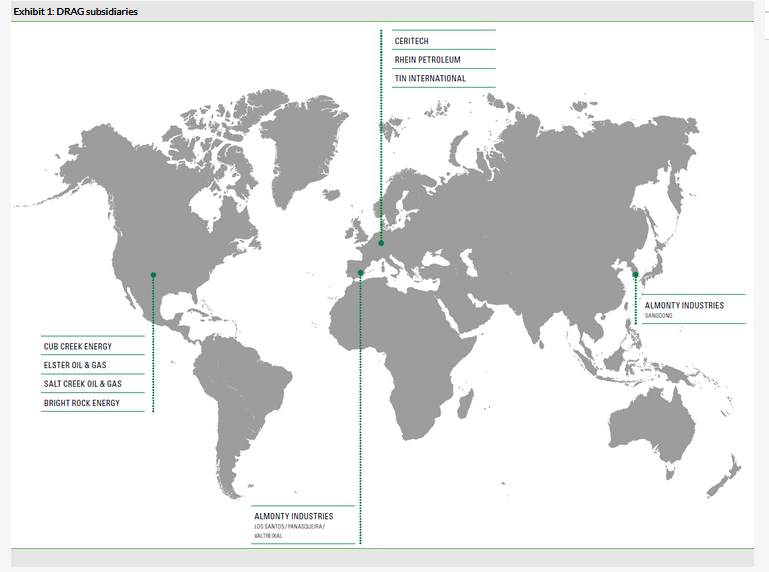
DRAG’s business strategy involves the identification, development and monetisation of attractive resource projects in the Americas and Europe. In 2018, group revenue increased to €109.1m from €53.7m in 2017 and EBITDA increased to €97.9m from €36.1m. The company currently has four US oil and gas assets – a 93.00% stake in Elster Oil & Gas, 88.46% in Cub Creek Energy, 100.00% in Salt Creek Oil & Gas, and 95.18% in newly founded Bright Rock Energy. Its strategy of buy, build and monetise is in evidence with the sale, agreed in April 2018, of most of Salt Creek’s assets. The group also laid the foundation for growth in 2018 by increasing its working interest in the US onshore drilling locations through Elster Oil & Gas and Cub Creek Energy in Colorado. In addition, Bright Rock Energy acquired its first acreage in Utah. These investments resulted in DRAG holding interests in 154 wells onshore US at the end of FY18.

Following a confirmed investment of approximately $70.0m through 2019, production is expected to increase significantly in 2020 and DRAG expects to benefit from the recent rise in WTI, which currently stands at c $60/bbl.
DRAG’s metal investments continue to benefit from a rise in underlying commodity prices. Metals at book value make up just 13% of our SOTP valuation.
Financials
DRAG is exposed to fluctuations in realised prices across multiple commodities, with greater leverage to oil and gas prices in the US, and regional discounts to the WTI crude and Henry Hub benchmarks.
Consensus versus guidance
Management guides at FY19 sales of €40–50m and EBITDA of €25–35m, c 30% and 47% lower than FY18, primarily driven by natural well depletion and forecast new investments expected to come online in early 2020. In FY20, the company guides at sales of €75–85m and an EBITDA of €55–65m. Current consensus expectations do not appear to reflect recent asset divestments or management guidance on future profitability/dividend payments. DRAG’s cash position and securities, held at €60.0.m at year-end FY18 (€56.8m as at 31 March 2019), provide sufficient liquidity for organic investment in the company’s existing asset footprint, the acreage built out of Bright Rock Energy with a focus on Utah/North Dakota, and the potential acquisition of further proven, developed producing reserves on an opportunistic basis.

Valuation
Considering the independent reserve valuation presented by DRAG in February 2019, the company’s market value is below the NPV10 of the 1P and 2P reserves for its net oil and gas investments, plus the book value of mining assets minus net debt. We believe asset value is an appropriate basis for valuing DRAG over traditional P&L metrics such as P/E or EV/EBITDA due to the nature of its investments.
Our year-end 2018 SOTP valuation (Exhibit 3) has slightly decreased compared to the 2017 year-end. The valuation of oil and gas assets and the mining assets book value have decreased, offset by a reduction in net debt (from €76.9m to €33.4m), driven by the disposal of Salt Creek acreage.
At the time of the independent report valuation, the WTI price was $51.44/bbl. If oil prices remain at current spot levels, above $60/bbl, a material upward revision to reserve values would be expected. We provide an updated SOTP valuation based on the latest numbers released by DRAG below, which moves marginally from our May 2018 update note (-0.4%).
