REVIEW
Last week we had four gap openings, three to the downside, and the market traded to SPX 1953 on Thursday before ending the week at 1968. This week we had four gap openings again, three to the upside, and the market traded to SPX 1956 on Thursday before ending the week at 1978. Meanwhile during all this volatility the SPX has yet to hit the bull market high at 1986 achieved the week before all this began. For the week the SPX/DOW were +0.70%, the NDX0/NAZ were +0.65%, and the DJ World index was +0.45%. On the economic front positive reports outpaced negative reports nine to six. On the uptick: the NY/Philly FED, retail sales, business inventories, the PPI, industrial production, the NAHB, leading indicators and weekly jobless claims improved. On the downtick: export/import prices, housing starts, building permits, consumer sentiment and the WLEI. Next week we get reports on home sales, durable goods and the CPI.
Long Term: Bull Market
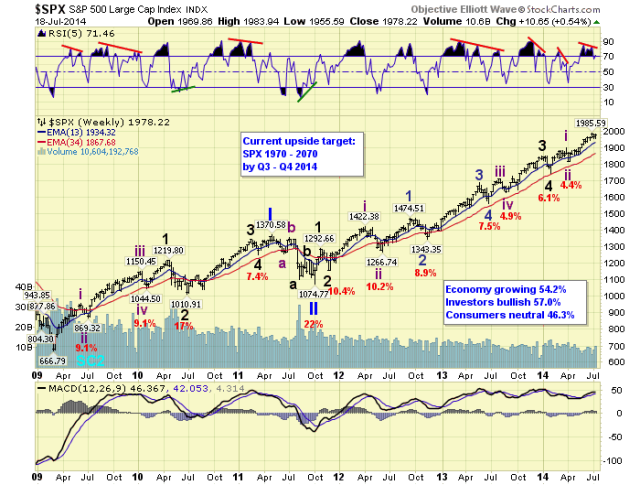
We continue to count the bull market of 2009 as Cycle wave [1] with five Primary waves. Primary waves I and II completed in 2011, and Primary wave III began then. Primary wave I had a subdividing Major wave 1 and simple Major waves 3 and 5. Primary III is just the opposite: a simple Major wave 1 and subdividing Major waves 3 and 5. We have counted Major waves 1 and 2 complete in late 2011, and Major waves 3 and 4 complete in early-2014. A subdividing Major wave 5 has been underway since that low.

When Major wave 5 concludes, Primary III will conclude as well. Then the market should experience its largest correction since 2011. However, when that Primary wave IV correction ends, the market should again makes new highs in Primary wave V.
Medium Term: Downtrend Probably Underway
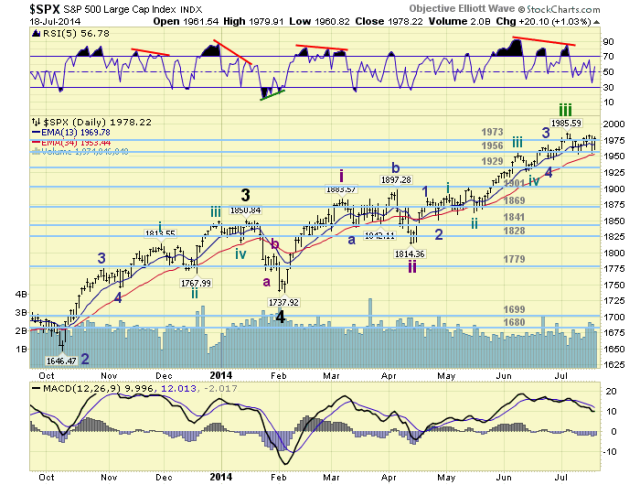
The recent uptrend began in mid-April at SPX 1814. It has unfolded in five Minor waves with a subdividing Minor wave 3. Recently Minor wave 5 hit SPX 1986, a near perfect 0.618 Fibonacci relationship to Minor wave 1. This new all time high was accompanied with negative divergences on the daily and weekly RSI/MACD. Also since that high, all eight European indices we track have entered confirmed downtrends. These are typically signs of a pending downtrend.

Since that high, however, the SPX has gone basically sideways. Trading between SPX 1953 and 1984 for two weeks, and closing at 1978 on Friday. Also, the narrow DOW, NDX and TRAN indices have all made new uptrend highs during the past two weeks. The larger indices, such as; the SPX, NAZ and NYA have failed to do so. The recent market activity looks similar to the Major wave 3 high: a trading range for a couple of weeks with rising volume. For now, we continue to label the SPX 1986 high as the end of Intermediate wave iii. Should an Intermediate wave iv downtrend get confirmed, as expected, then an Intermediate wave v uptrend will again take the market to new highs. When it completes so does Primary wave III. Medium term support is at the 1973 and 1956 pivots, with resistance at the 2019 and 2070 pivots.
Short Term
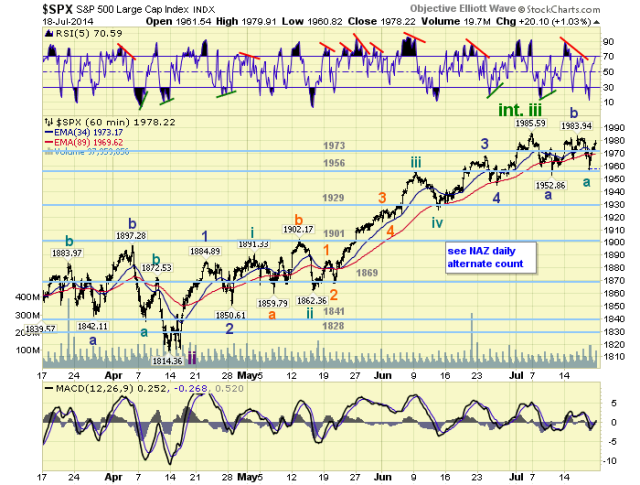
Short term support is at the 1973 and 1956 pivots, with resistance at SPX 1986 and the 2019 pivot. Short term momentum ended the week overbought. The short term OEW charts are positive with the reversal level SPX 1973.

Since the SPX 1986 high, two weeks ago, the market has been quite choppy with eight gap openings. We first had a decline to SPX 1953 (1956-1974-1953), we labeled that Minor A. Then a rally to SPX 1984 (1970-1960-1983-1965-1984), we labeled that Minor B. Now we have had a decline to SPX 1956 (1966-1976-1956), and on Friday a rally to SPX 1980. We are counting the decline to SPX 1956 as Minute A, and Friday’s rally as Minute B. Another decline, Minute C, should follow shortly.