Dell Inc. (DELL) is a global information technology company that offers its customers a range of solutions and services delivered directly by Dell and through other distribution channels. Dell is a holding company that conducts its business worldwide through its subsidiaries.
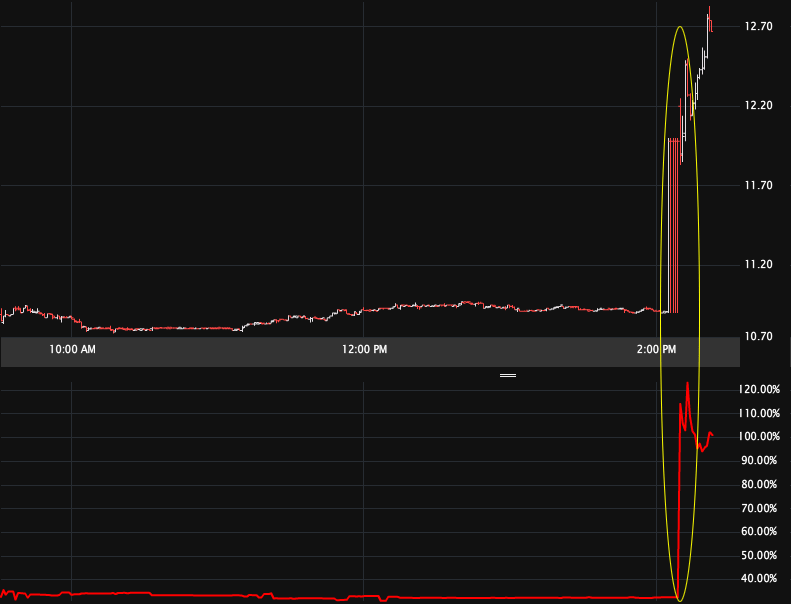
DELL stock popped and vol exploded just after 2pm EST yesterday. The Tick Chart is included below (top portion is stock price, bottom is Jan vol).
So here's the news on DELL if you don't already know:
Dell Inc. (DELL), the personal-computer maker that lost almost a third of its value last year, is in buyout talks with private-equity firms, two people with knowledge of the matter said.
Round Rock, Texas-based Dell is discussing going private with at least two firms, said one of the people, who declined to be identified because the talks are private. The discussions are preliminary and could fall apart because the firms may not be able to line up the needed financing or resolve how to exit the investment in the future, the people said.
Several large banks have been contacted about financing an offer, one of the people said. -- Source: Bloomberg via Yahoo! news; Dell Said to Be in Buyout Talks With Private-Equity Firms, written by Serena Saitto & Jeffrey McCracken.
DELL shows up on so many vol scans it's hard count; suffice it to say these four caught my eye:
(1) Day Vol Gain
(2) Exploding Vol
(3) Calendar Spread Months 1 to 2
(4) Calendar Spread Months 2 to 3
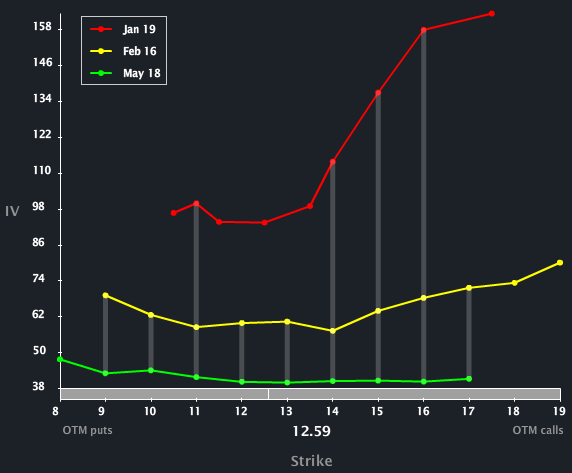
Let's start with the Skew Tab, because of all the scans, it's the most compelling to me. 
We can see a couple of phenomena here:
(1) There is a monotonic vol increase from the back to the front.
(2) The front month (5 day options) have a decidedly upside skew
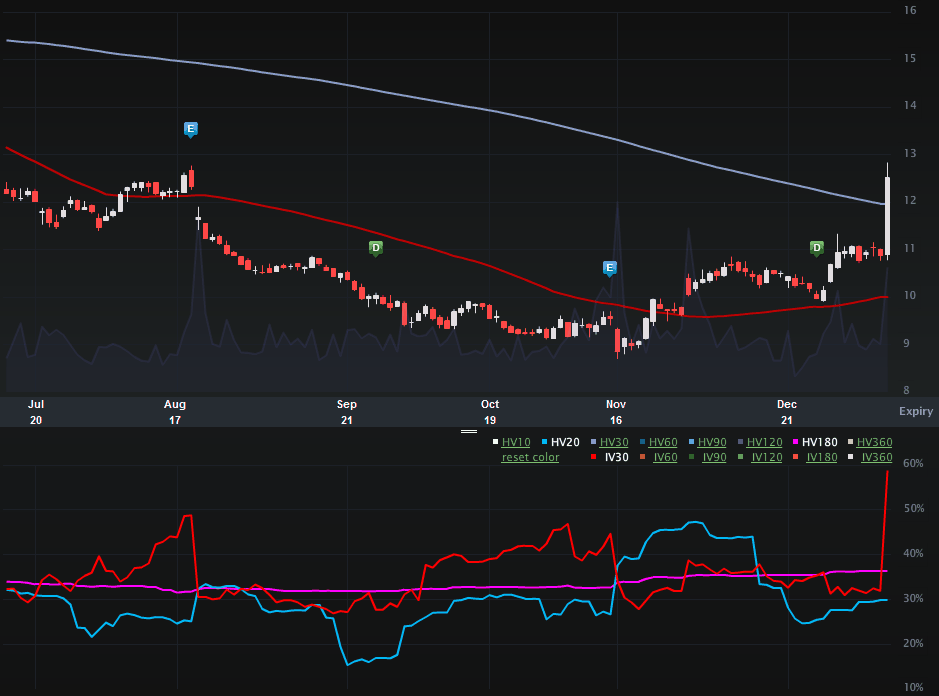
Let's turn to the Charts Tab (six months), below. The top portion is the stock price, the bottom is the vol (IV30™ - red vs HV20™ - blue vs HV180™ - pink).
On the stock side we can see what has been a rather boring stock with implied vol in the 30% range and historical realized vol (short-term) even lower than that, has suddenly gapped up.
The vol side, well, how about a vol increase of ~85% in a few minutes?
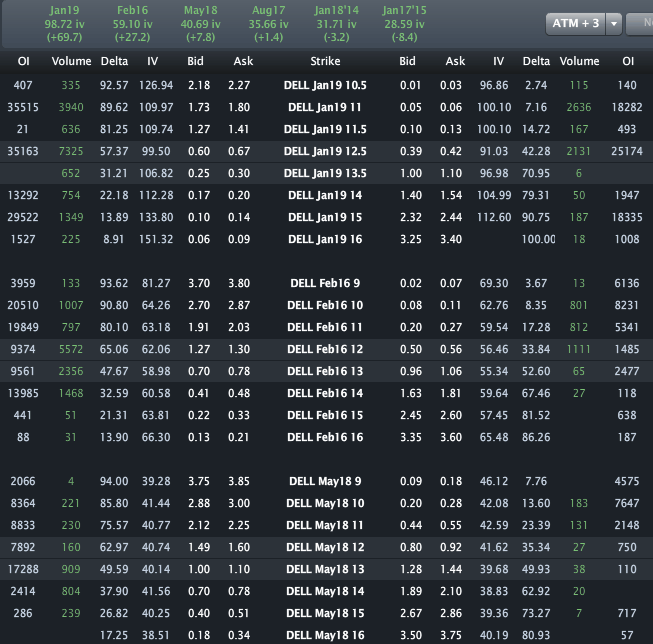
Finally, let's turn to the Options Tab.
Across the top we can see Jan vol is up nearly 70 points from 28% on Friday, so a several hundred fold percent increase. Feb vol is up ~85% (Feb vol ~ IV30™ this close to Jan expo).
Here's the real question in the ultra short-term: "Will DELL go back down below say, $11.50 in the next few days (before this expo?)." The vol is priced to over 100% on those puts. Perusing the news, this does not sound like a whisper that will fade into the wind -- at least not by this coming Friday... Or will it?...
Disclosure: This is trade analysis, not a recommendation.
Images provided by Livevol®
- English (UK)
- English (India)
- English (Canada)
- English (Australia)
- English (South Africa)
- English (Philippines)
- English (Nigeria)
- Deutsch
- Español (España)
- Español (México)
- Français
- Italiano
- Nederlands
- Português (Portugal)
- Polski
- Português (Brasil)
- Русский
- Türkçe
- العربية
- Ελληνικά
- Svenska
- Suomi
- עברית
- 日本語
- 한국어
- 简体中文
- 繁體中文
- Bahasa Indonesia
- Bahasa Melayu
- ไทย
- Tiếng Việt
- हिंदी
Dell: Stock Pops, Vol Explodes On Potential Private Buy-Out News
Published 01/15/2013, 01:18 AM
Updated 07/09/2023, 06:31 AM
Dell: Stock Pops, Vol Explodes On Potential Private Buy-Out News
Latest comments
Loading next article…
Install Our App
Risk Disclosure: Trading in financial instruments and/or cryptocurrencies involves high risks including the risk of losing some, or all, of your investment amount, and may not be suitable for all investors. Prices of cryptocurrencies are extremely volatile and may be affected by external factors such as financial, regulatory or political events. Trading on margin increases the financial risks.
Before deciding to trade in financial instrument or cryptocurrencies you should be fully informed of the risks and costs associated with trading the financial markets, carefully consider your investment objectives, level of experience, and risk appetite, and seek professional advice where needed.
Fusion Media would like to remind you that the data contained in this website is not necessarily real-time nor accurate. The data and prices on the website are not necessarily provided by any market or exchange, but may be provided by market makers, and so prices may not be accurate and may differ from the actual price at any given market, meaning prices are indicative and not appropriate for trading purposes. Fusion Media and any provider of the data contained in this website will not accept liability for any loss or damage as a result of your trading, or your reliance on the information contained within this website.
It is prohibited to use, store, reproduce, display, modify, transmit or distribute the data contained in this website without the explicit prior written permission of Fusion Media and/or the data provider. All intellectual property rights are reserved by the providers and/or the exchange providing the data contained in this website.
Fusion Media may be compensated by the advertisers that appear on the website, based on your interaction with the advertisements or advertisers.
© 2007-2024 - Fusion Media Limited. All Rights Reserved.
