Get 40% Off
🤯 Perficient is up a mind-blowing 53%. Our ProPicks AI saw the buying opportunity in March.Read full update

DAX: Elliott Wave Zig Zag Pattern

Published 11/02/2015, 09:22 PM
Updated 03/09/2019, 08:30 AM


Zig-Zag is the most famous corrective pattern in Elliott Wave Theory, but in reality we don’t see it very often. These days we could see very nice zig zag pattern that is forming in DAX h1 chart. Before we take a look at real example, we will explain the Elliott Wave pattern first.

Zig zag is a 3 wave corrective Elliott Wave pattern that contains 5-3-5 inner structure. It’s labeled as A,B,C where A =5 waves, B=3 waves and C=5 waves. That means A and C are impulsive or diagonal patterns, and they must meet all conditions of being 5 wave structures such as: having RSI divergency between wave subdivisions, ideal Fibonacci extensions, retracements and so on…

Now let’s take a look at real market example of DAX:

DAX 10.282.2015 NY Update: Zig Zag Pattern is forming; currently we’re in wave 5 red of (C) blue, which is expected to give us more strength to complete the pattern. We could see wave (A) ended at 10114.7 as leading diagonal structure. Wave (B) pull back completed right at 38.2 fib retracement level at 9886.9, and from there, the price is forming clear impulsive 5 wave structure, where each of 5 waves contains 5 waves subdivision. Wave 4 red is done at 10695.2, and while the price holds above that level, we should ideally see another 5 wave rally toward 9886.9+ area to complete zig zag pattern.
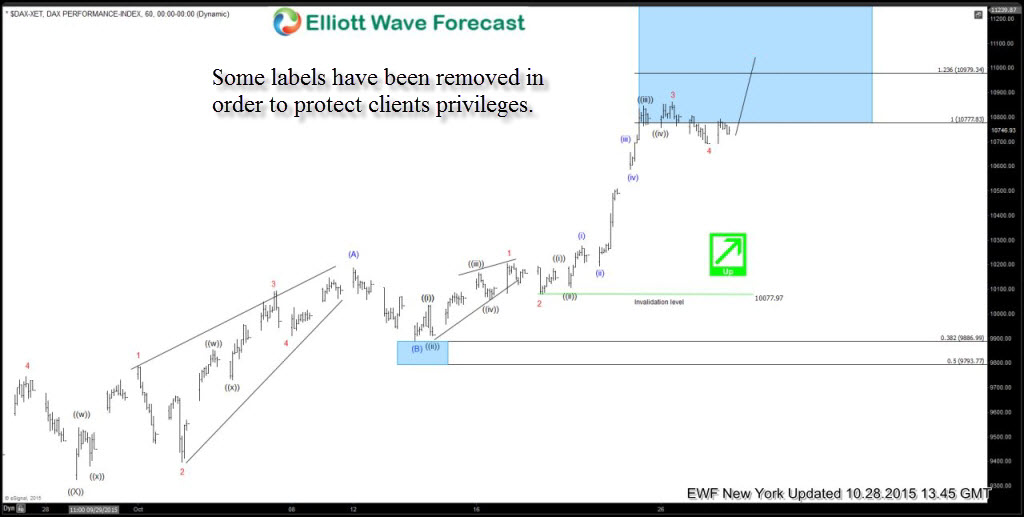
DAX Elliott Wave Chart

Latest comments

Risk Disclosure: Trading in financial instruments and/or cryptocurrencies involves high risks including the risk of losing some, or all, of your investment amount, and may not be suitable for all investors. Prices of cryptocurrencies are extremely volatile and may be affected by external factors such as financial, regulatory or political events. Trading on margin increases the financial risks.
Before deciding to trade in financial instrument or cryptocurrencies you should be fully informed of the risks and costs associated with trading the financial markets, carefully consider your investment objectives, level of experience, and risk appetite, and seek professional advice where needed.
Fusion Media would like to remind you that the data contained in this website is not necessarily real-time nor accurate. The data and prices on the website are not necessarily provided by any market or exchange, but may be provided by market makers, and so prices may not be accurate and may differ from the actual price at any given market, meaning prices are indicative and not appropriate for trading purposes. Fusion Media and any provider of the data contained in this website will not accept liability for any loss or damage as a result of your trading, or your reliance on the information contained within this website.
It is prohibited to use, store, reproduce, display, modify, transmit or distribute the data contained in this website without the explicit prior written permission of Fusion Media and/or the data provider. All intellectual property rights are reserved by the providers and/or the exchange providing the data contained in this website.
Fusion Media may be compensated by the advertisers that appear on the website, based on your interaction with the advertisements or advertisers.
© 2007-2024 - Fusion Media Limited. All Rights Reserved.