Callaway Golf (ELY) is in the Danger Zone this week. ELY is priced for significant profit growth despite declining revenues, increased pressure from competitors, and limited growth potential in the golf equipment industry. Investors should be wary of stocks like ELY where the best-case scenario is already priced in.
Declining Revenues and Profits
Callaway has seen significant decline in its revenues and after tax profit (NOPAT) over the past two years. Between 2010 and 2012 Callaway’s NOPAT declined from nearly break even down to -$51 million, while its total revenue declined by 14%. Callaway’s recent profitability issues are no secret, but a closer look at the numbers suggests that Callaway’s issues could be more serious than many believe.
Advertising Ineffectual
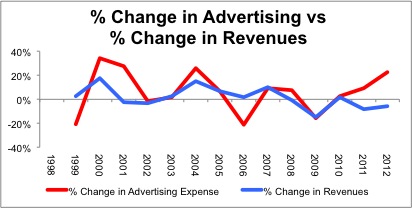
From 1999-2010 there was a fairly clear correlation between Callaway’s advertising expense and its revenue. As Figure 1 shows, an increase in the amount of money spent on advertising typically resulted in increasing revenue, and decreasing advertising costs typically correlated with decreasing revenue. However, in 2011 and 2012 Callaway increased its advertising budget by 10% and 23% respectively while revenues continued to fall.
Figure 1: Change in Advertising Expense vs. Change in Revenues
Sources: New Constructs, LLC and company filings
When a company is increasing its advertising budget by that much and not seeing a commensurate growth in sales, investors have to be worried that the value of that company’s brand is eroding. If that graph alone is not enough to convince you of that point, there is more evidence that the Callaway brand is not as strong as it used to be.
Decline In Core Product Revenues
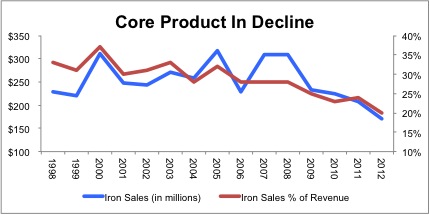
Callaway sells a variety of golf clubs, balls, and accessories, but its irons have long been central to the company’s marketing efforts. For years it promoted its irons as “the #1 Irons in Golf”, a claim not made about any of its other products. Given the emphasis placed upon its irons in marketing efforts, it should be concerning for Callaway investors that the company has seen its iron sales decline significantly both in total and as a percent of the company’s revenue.
Figure 2: Gross Iron Sales and As a Percent of Revenue 
Sources: New Constructs, LLC and company filings
Decline in Revenues and Profits While Industry Remains Buoyant
While some of Callaway’s struggles can be blamed on the slow recovery of consumer spending after the recession, their issues go deeper than that. US consumer spending on golf equipment has increased slightly over the past two years, so Callaway’s revenues should have at least stayed flat.
Competition Is Only Getting Tougher
Callaway’s market share has been steadily decreasing while its main competitor, TaylorMade, has increased its leadership in the market. From 2004-2008, Callaway and TaylorMade had nearly equal sales. In 2012, TaylorMade’s sales were more than double that of Callaway. TaylorMade is the largest golf company in the world and does not appear to be losing ground to anyone. TaylorMade has established themselves as the dominant brand in golf over the past few years. They boast 91 tour pros using their clubs compared to only 20 for Callaway. While Callaway discontinued its popular Big Bertha line of clubs in 2009, TaylorMade’s R series and Burner series are among the most recognizable brands in the game. Given the ineffectiveness of Callaway’s marketing efforts so far and their declining capital expenditure, it’s hard to see where the potential is for them to take back significant market share.
Unrealistic Growth Expectations = Dangerous Stock Valuation
Not only is Callaway priced to return to profitability, the current share price implies that Callaway will become more profitable than anytime in the last decade. To justify its share price of ~$6.70, Callaway would need to increase revenues by 15% per year for 11 years and bring its return on invested capital (ROIC) up to 10%. Since 2003, Callaway has never earned an ROIC above 9%. Revenue growth is unlikely to come from a growing market. Golf equipment sales made only modest gains over the past two years despite a recovering economy, and golf participation has been declining for several years. With TaylorMade dominating the market place and Callaway’s advertising efforts failing to boost its top line, one would think that increased investment in new products would be the necessary step for Callaway to regain some traction. Instead, Callaway decreased its capital expenditure by 34% last year and 74% since 2008. Without more investment in new products, it is difficult to see how Calloway could generate the growth expectations in their stock price. It will take more than cost cutting and increased consumer spending for Callaway to have any chance of rewarding investors.
Sam McBride and Greg Slaughter contributed to this report
Disclosure: David Trainer, Sam McBride, and Greg Slaughter receive no compensation to write about any specific stock, sector, or theme.
- English (UK)
- English (India)
- English (Canada)
- English (Australia)
- English (South Africa)
- English (Philippines)
- English (Nigeria)
- Deutsch
- Español (España)
- Español (México)
- Français
- Italiano
- Nederlands
- Português (Portugal)
- Polski
- Português (Brasil)
- Русский
- Türkçe
- العربية
- Ελληνικά
- Svenska
- Suomi
- עברית
- 日本語
- 한국어
- 简体中文
- 繁體中文
- Bahasa Indonesia
- Bahasa Melayu
- ไทย
- Tiếng Việt
- हिंदी
Danger Zone: Callaway Golf
Published 07/10/2013, 04:57 AM
Updated 07/09/2023, 06:31 AM
Danger Zone: Callaway Golf
3rd party Ad. Not an offer or recommendation by Investing.com. See disclosure here or
remove ads
.
Latest comments
Install Our App
Risk Disclosure: Trading in financial instruments and/or cryptocurrencies involves high risks including the risk of losing some, or all, of your investment amount, and may not be suitable for all investors. Prices of cryptocurrencies are extremely volatile and may be affected by external factors such as financial, regulatory or political events. Trading on margin increases the financial risks.
Before deciding to trade in financial instrument or cryptocurrencies you should be fully informed of the risks and costs associated with trading the financial markets, carefully consider your investment objectives, level of experience, and risk appetite, and seek professional advice where needed.
Fusion Media would like to remind you that the data contained in this website is not necessarily real-time nor accurate. The data and prices on the website are not necessarily provided by any market or exchange, but may be provided by market makers, and so prices may not be accurate and may differ from the actual price at any given market, meaning prices are indicative and not appropriate for trading purposes. Fusion Media and any provider of the data contained in this website will not accept liability for any loss or damage as a result of your trading, or your reliance on the information contained within this website.
It is prohibited to use, store, reproduce, display, modify, transmit or distribute the data contained in this website without the explicit prior written permission of Fusion Media and/or the data provider. All intellectual property rights are reserved by the providers and/or the exchange providing the data contained in this website.
Fusion Media may be compensated by the advertisers that appear on the website, based on your interaction with the advertisements or advertisers.
© 2007-2024 - Fusion Media Limited. All Rights Reserved.
