
EUR/USD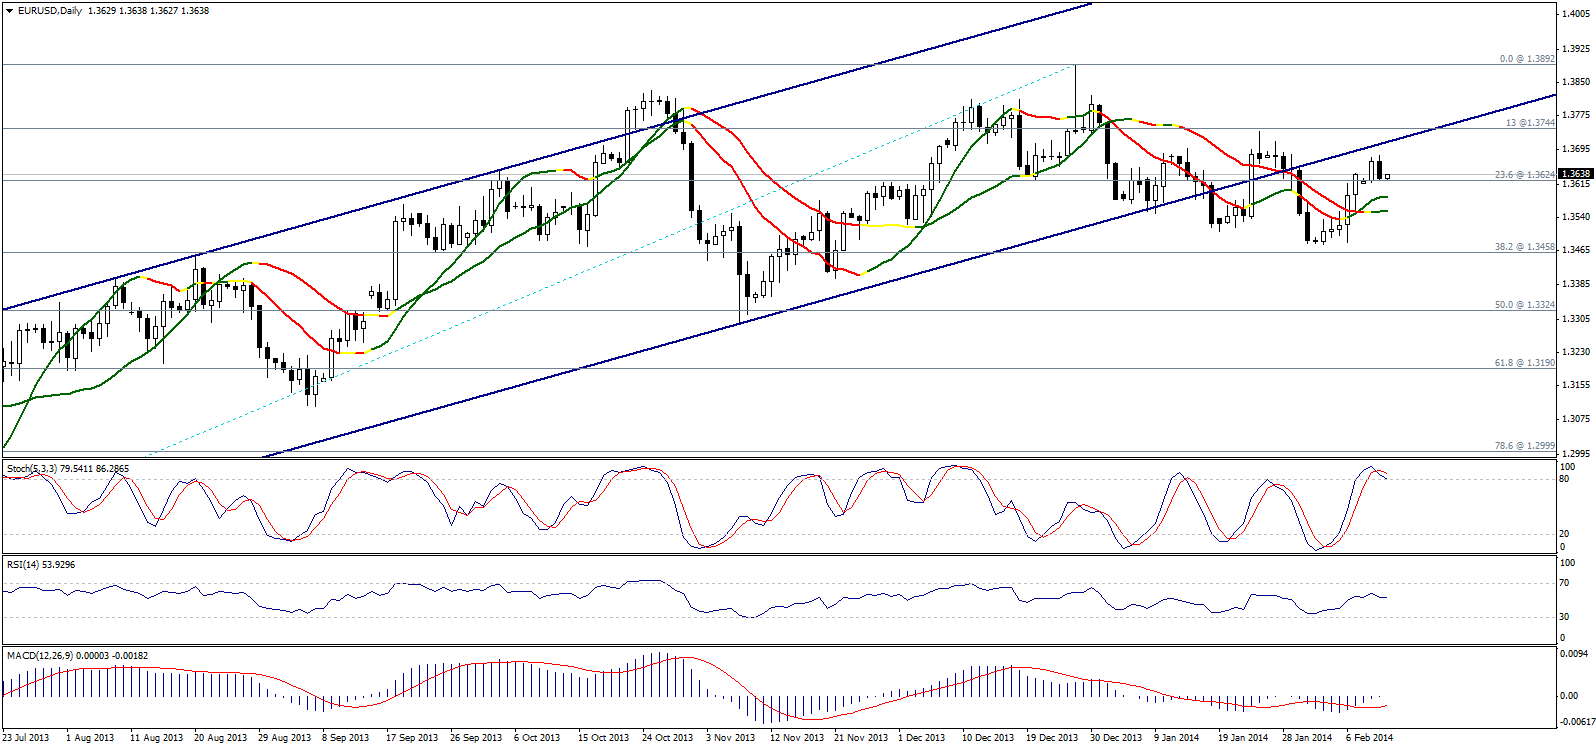 EUR/USD Daily Chart" title="EUR/USD Daily Chart" width="1596" height="746">
The pair dropped yesterday and remained limited above 23.6% correction at 1.3620 levels as showing on graph. Stability above the referred to level strengthens the bullish possibility in an attempt to test the previously broken support level that turned to resistance as showing on graph.
Linear Regression Indicators are positive and RSI is trading above line 50 supporting the expectations. Stochastic is showing a negative bias from overbought signals, as the pair should breach 1.3685 to cancel any possibility of responding to the negative signals on momentum indicators.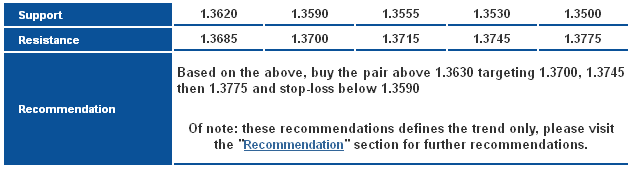 EUR/USD S&R Chart" title="EUR/USD S&R Chart" width="632" height="171">
GBP/USD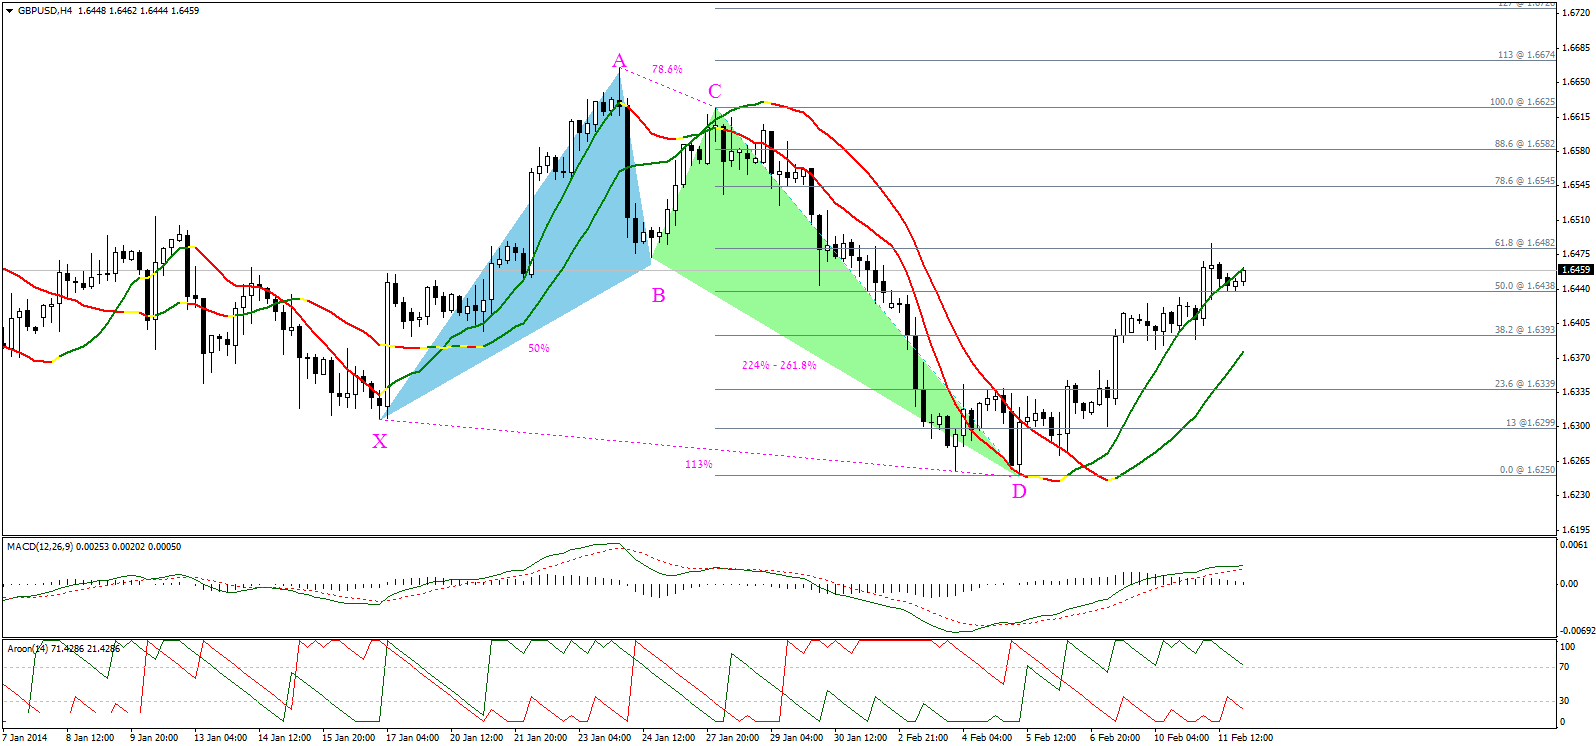 GBP/USD Hourly Chart" title="GBP/USD Hourly Chart" width="1596" height="746">
The pair managed to touch the second target of the alternative bullish harmonic Bat Pattern at 1.6485 represented in 61.8% correction of CD Leg of the pattern. Based on technical analysis rules, extending the upside move requires breaching the referred to level, but the pair has rebounded to the downside and is currently trading in middle levels between 61.8% correction from the upside and 50% correction at 1.6435 from the downside.
Linear Regression Indicators are positive but AROON is showing that the upside move is losing its momentum, while MACD histogram began to drop. Therefore, we will place stop-loss below 1.6380 and we wait for an entry point close to 50% correction to reduce the risk in our recommendation today.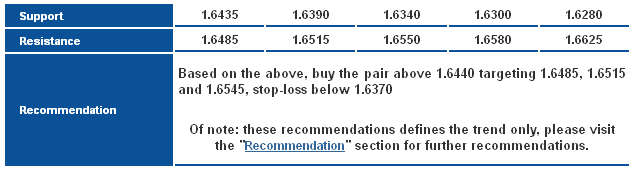 GBP/USD S&R Chart" title="GBP/USD S&R Chart" width="633" height="171">
USD/JPY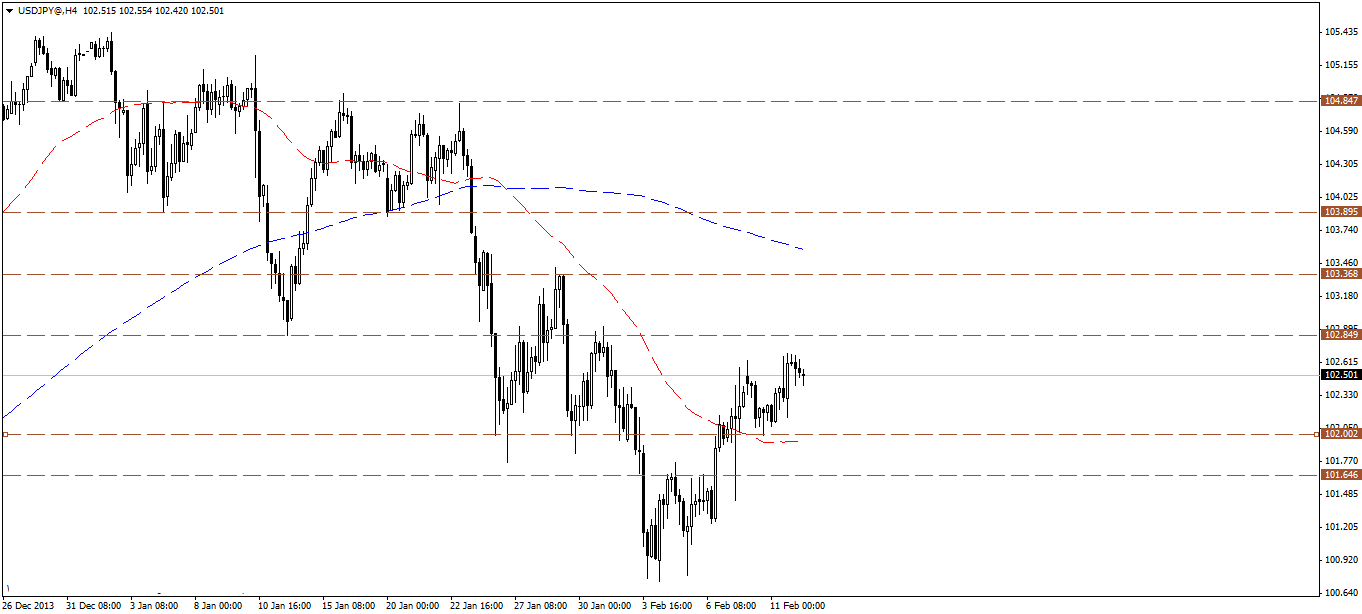 USD/JPY Hourly Chart" title="USD/JPY Hourly Chart" width="1362" height="614">
The USD/JPY pulls back slightly after testing the recent minor high at 102.60 resistance, where holding above 102.00 for today should keep the bullish bias favored, A break above 102.60 is necessary now to signal the resumption of the bullish rebound, targeting 103.00 and 103.40 levels.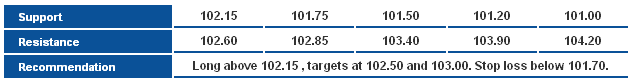 USD/JPY S&R Chart" title="USD/JPY S&R Chart" width="635" height="84">
USD/CHF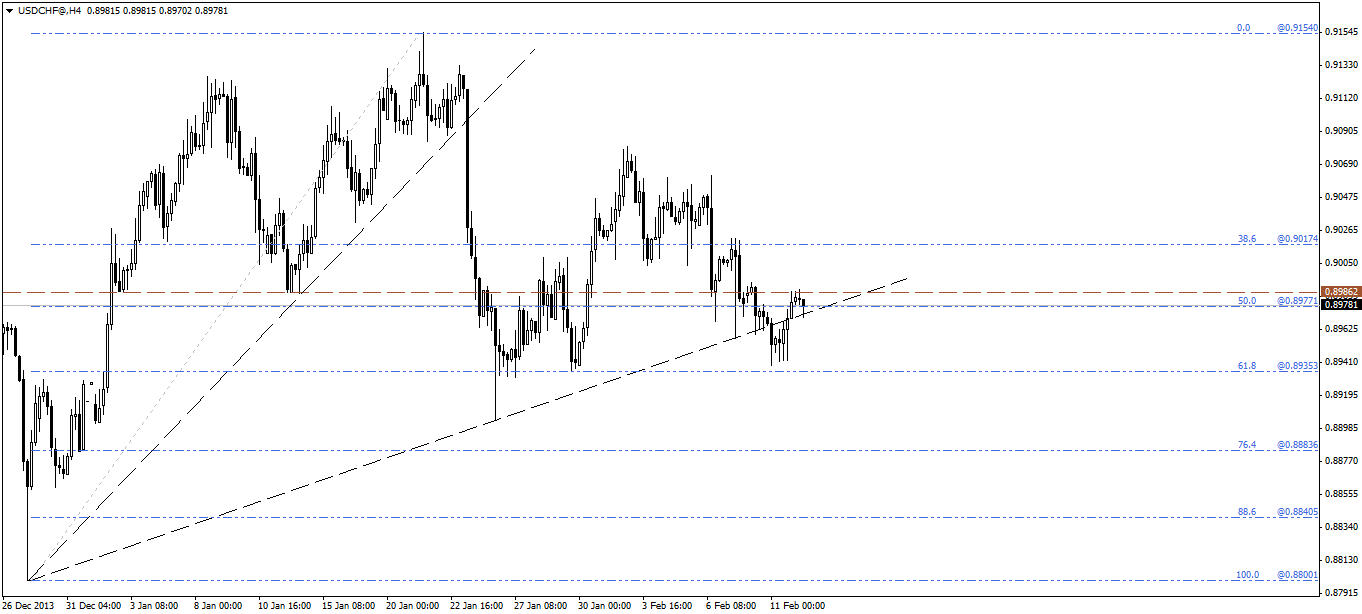 USD/CHF Hourly Chart" title="USD/CHF Hourly Chart" width="1362" height="614">
The USD/CHF moved higher yesterday but price remains below 0.9000 level and the 50-days SMA, accordingly, the bearish scenario remains favored for today, unless price manages to break and hold above 0.9000 level. USD/CHF S&R Chart" title="USD/CHF S&R Chart" width="631" height="83">
USD/CAD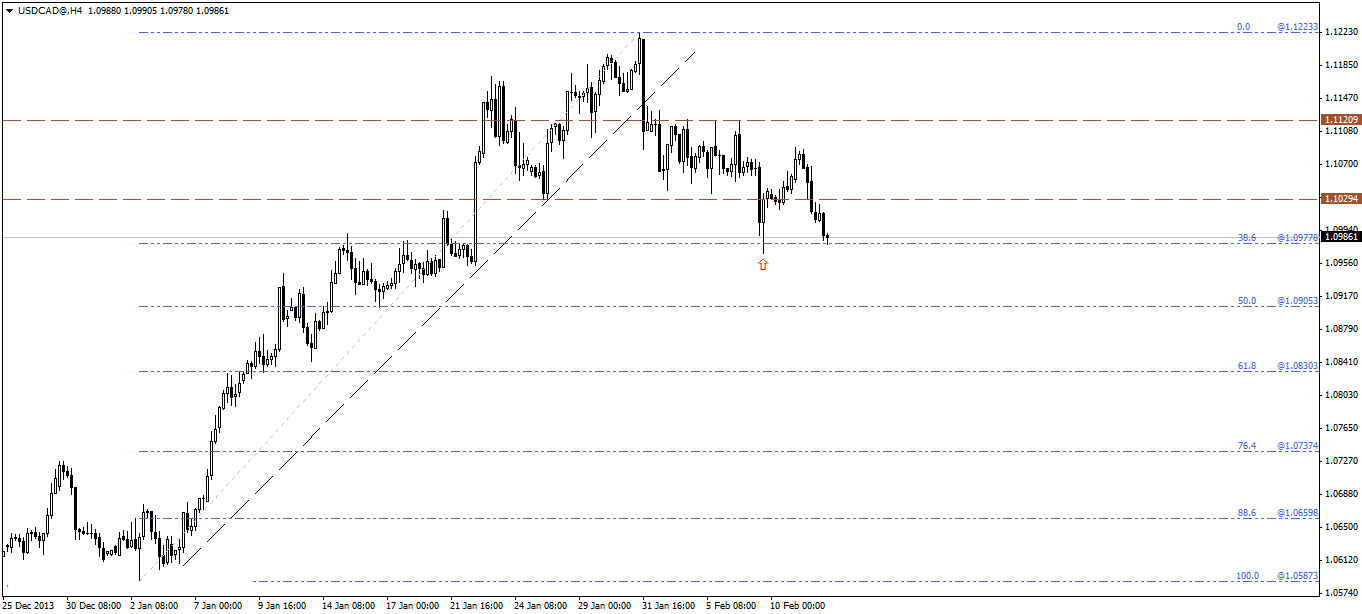 USD/CAD Hourly Chart" title="USD/CAD Hourly Chart" width="1362" height="614">
The USD/CAD has broken 1.1030 supprt level, and retesting the recent key low and the 38.6 Fibonacci retracement level around 1.0975. A break below this support may confirm further downside; on the other hand we need a break back above 1.1030 to revive the bullish scenario.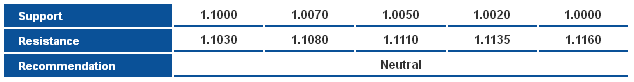 USD/CAD S&R Chart" title="USD/CAD S&R Chart" width="634" height="82">
AUD/USD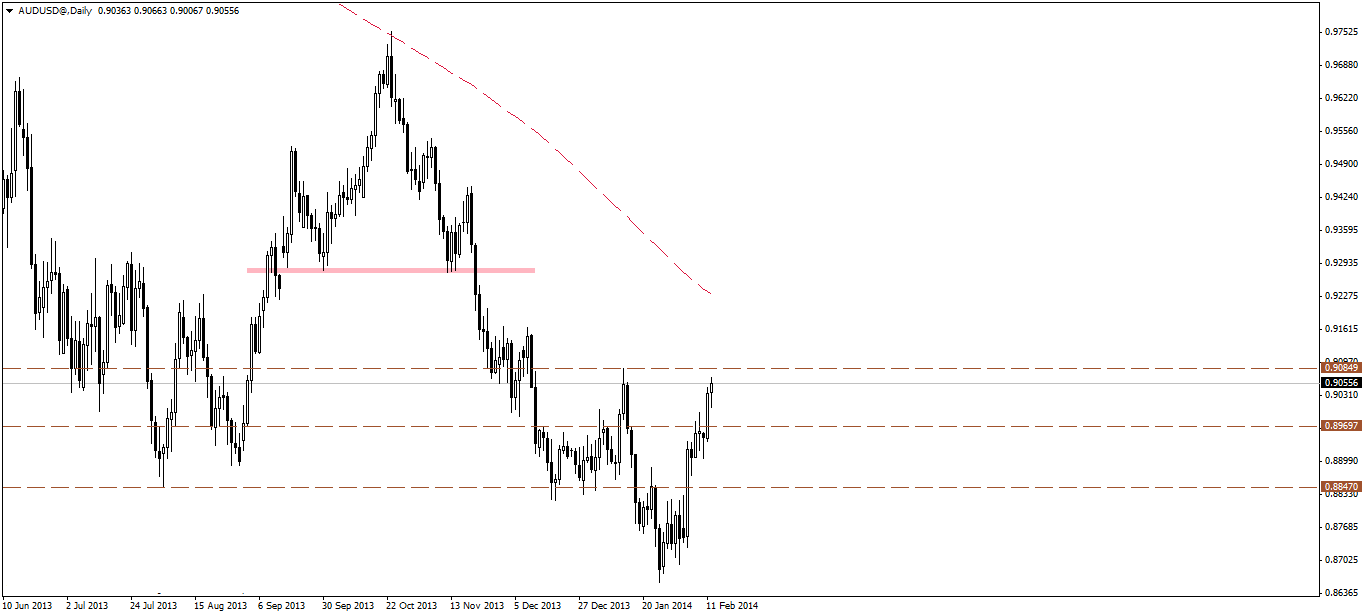 AUD/USD Daily Chart" title="AUD/USD Daily Chart" width="1362" height="614">
The AUD/USD lands near 0.9080 resistance level, and major pivot, which may halt further upside in the near term. A break above the latter should signal further strong upside and targets at 0.9170 as a next near term target. However, a break above 0.9080 is required to confirm this scenario. Accordingly, we prefer to move to the sidelines awaiting confirmation.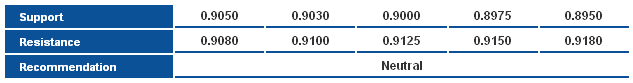 AUD/USD S&R Chart" title="AUD/USD S&R Chart" width="633" height="83">
NZD/USD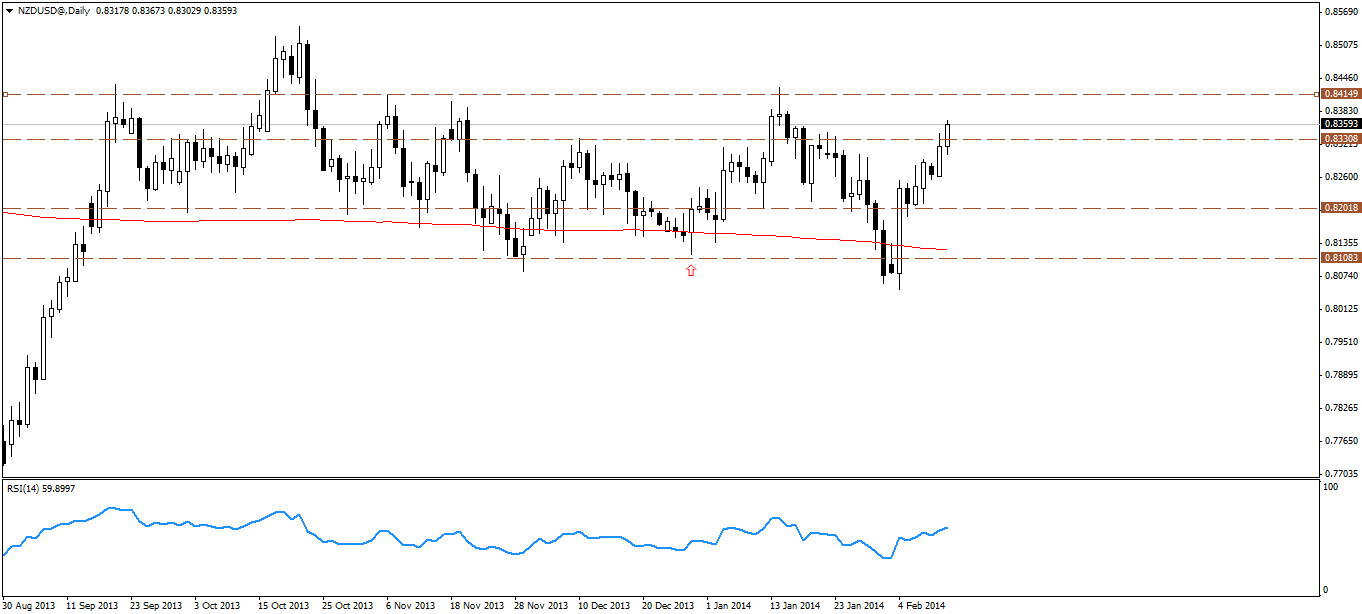 NZD/USD Daily Chart" title="NZD/USD Daily Chart" width="1362" height="614">
The NZD/USD extended the strong bullish move yesterday, breaking 0.8330-0.8340 resistance level, and that will probably extend the upside towards the next major resistance level around 0.8415 areas. Holding above 0.8300 today should keep the bullish bias dominant.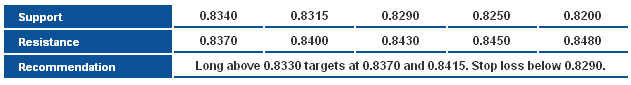 NZD/USD S&R Chart" title="NZD/USD S&R Chart" width="631" height="85">
- English (UK)
- English (India)
- English (Canada)
- English (Australia)
- English (South Africa)
- English (Philippines)
- English (Nigeria)
- Deutsch
- Español (España)
- Español (México)
- Français
- Italiano
- Nederlands
- Português (Portugal)
- Polski
- Português (Brasil)
- Русский
- Türkçe
- العربية
- Ελληνικά
- Svenska
- Suomi
- עברית
- 日本語
- 한국어
- 简体中文
- 繁體中文
- Bahasa Indonesia
- Bahasa Melayu
- ไทย
- Tiếng Việt
- हिंदी
Daily Technical: USD/CAD Broke 1.1030 Support Level
Published 02/12/2014, 05:07 AM
Updated 07/09/2023, 06:31 AM
Daily Technical: USD/CAD Broke 1.1030 Support Level
3rd party Ad. Not an offer or recommendation by Investing.com. See disclosure here or
remove ads
.
Latest comments
Install Our App
Risk Disclosure: Trading in financial instruments and/or cryptocurrencies involves high risks including the risk of losing some, or all, of your investment amount, and may not be suitable for all investors. Prices of cryptocurrencies are extremely volatile and may be affected by external factors such as financial, regulatory or political events. Trading on margin increases the financial risks.
Before deciding to trade in financial instrument or cryptocurrencies you should be fully informed of the risks and costs associated with trading the financial markets, carefully consider your investment objectives, level of experience, and risk appetite, and seek professional advice where needed.
Fusion Media would like to remind you that the data contained in this website is not necessarily real-time nor accurate. The data and prices on the website are not necessarily provided by any market or exchange, but may be provided by market makers, and so prices may not be accurate and may differ from the actual price at any given market, meaning prices are indicative and not appropriate for trading purposes. Fusion Media and any provider of the data contained in this website will not accept liability for any loss or damage as a result of your trading, or your reliance on the information contained within this website.
It is prohibited to use, store, reproduce, display, modify, transmit or distribute the data contained in this website without the explicit prior written permission of Fusion Media and/or the data provider. All intellectual property rights are reserved by the providers and/or the exchange providing the data contained in this website.
Fusion Media may be compensated by the advertisers that appear on the website, based on your interaction with the advertisements or advertisers.
© 2007-2024 - Fusion Media Limited. All Rights Reserved.