
Weekly Report
EUR/USD
 EUR/USD Daily Chart" title="EUR/USD Daily Chart" width="474" height="242">
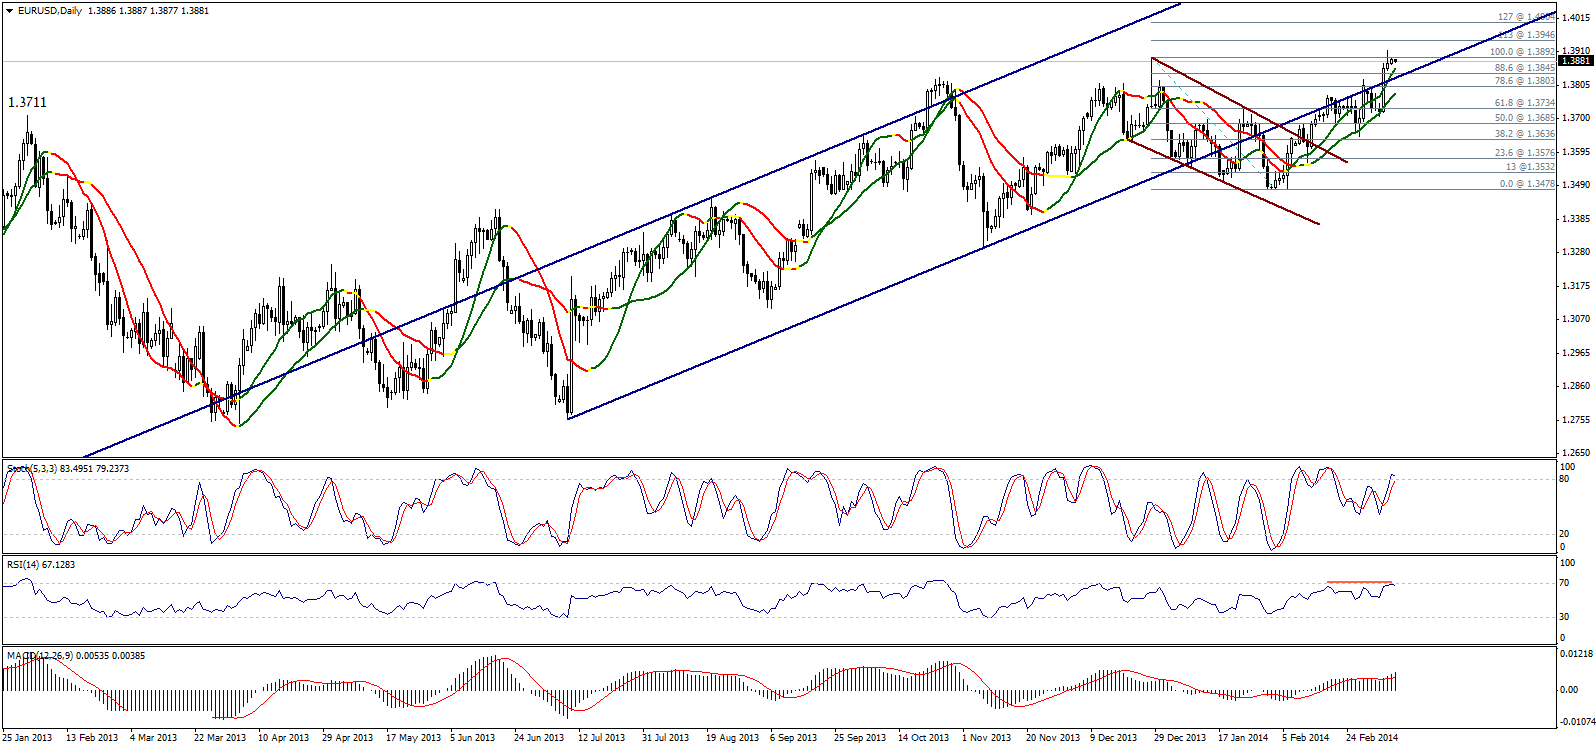
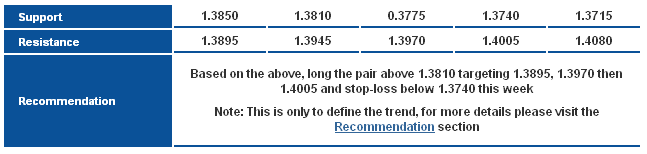
The upside move seen last week carried the EUR/USD back within the medium-term ascending channel alongside returning above the Linear Regression Indicators 34 & 55. Stability above 1.3810 is considered positive and we will depend this week on stability above the aforementioned level.
RSI and Stochastic are both trading negatively, and we will ignore the signals as far as the pair holds above 1.3775 which is the Linear Regression Indicators 55.
 EUR/USD S&R Chart" title="EUR/USD S&R Chart" width="474" height="242">
GBP/USD
 GBP/USD Daily Chart" title="GBP/USD Daily Chart" width="474" height="242">
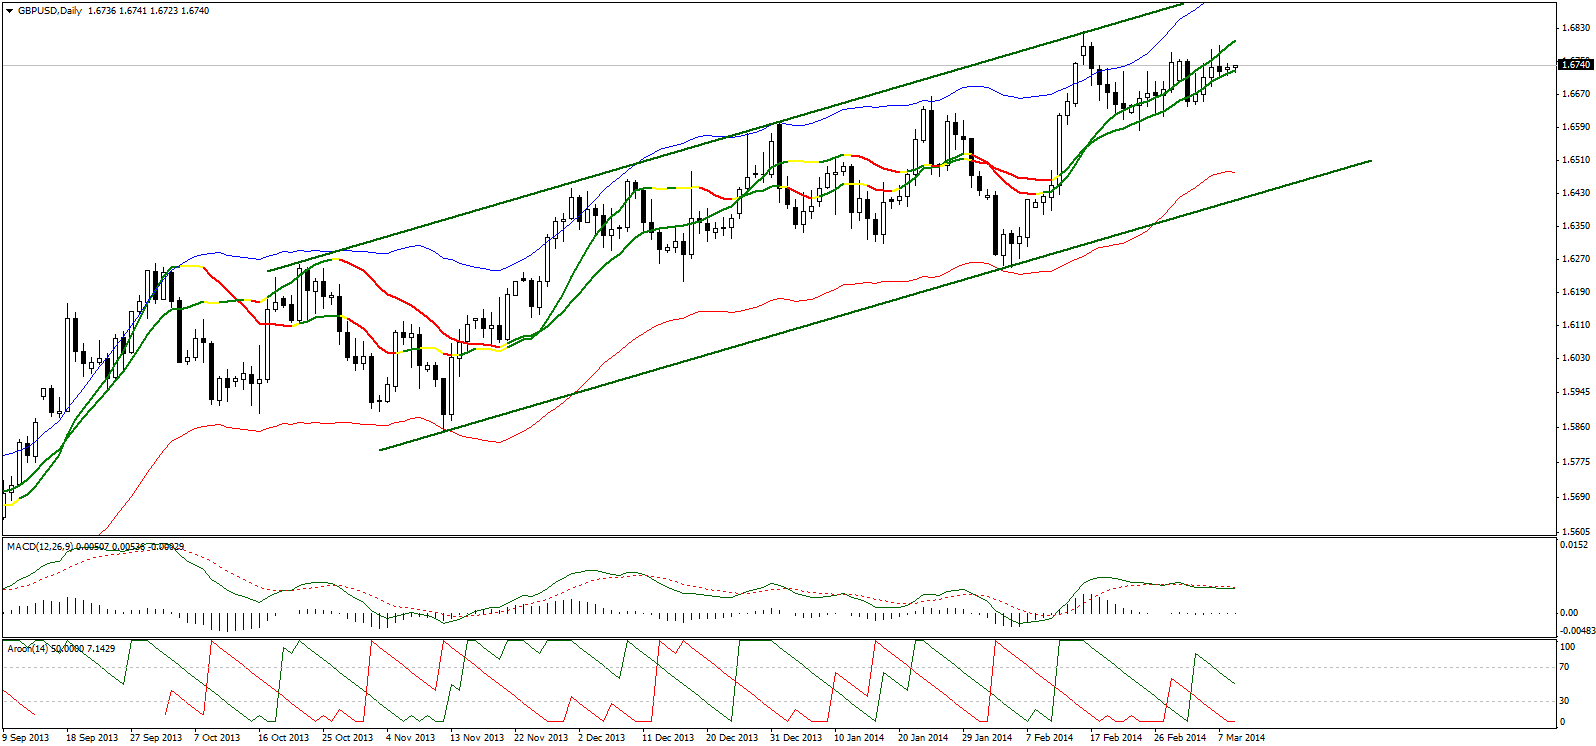
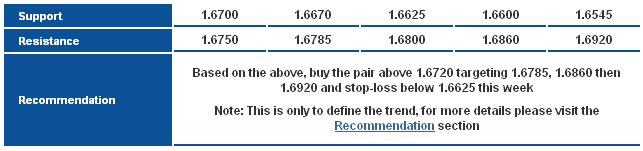
The pair traded that week within a sideways range after the sharp drop with the kick-start of trading last week. The pair is stable above the Linear Regression Indicator 55 and above 1.6600 and that keeps the bullish bias intact.
We will depend this week on stability above 1.6600 to favor bullishness, but a daily closing above 1.6750 is now required to support the positive outlook. AROON shows a drop in upside momentum and MACD is trading sideways and that requires a breach of 1.6750 to confirm the intraday upside move.
 GBP/USD S&R Chart" title="GBP/USD S&R Chart" width="474" height="242">
USD/JPY
 USD/JPY Daily Chart" title="USD/JPY Daily Chart" width="474" height="242">
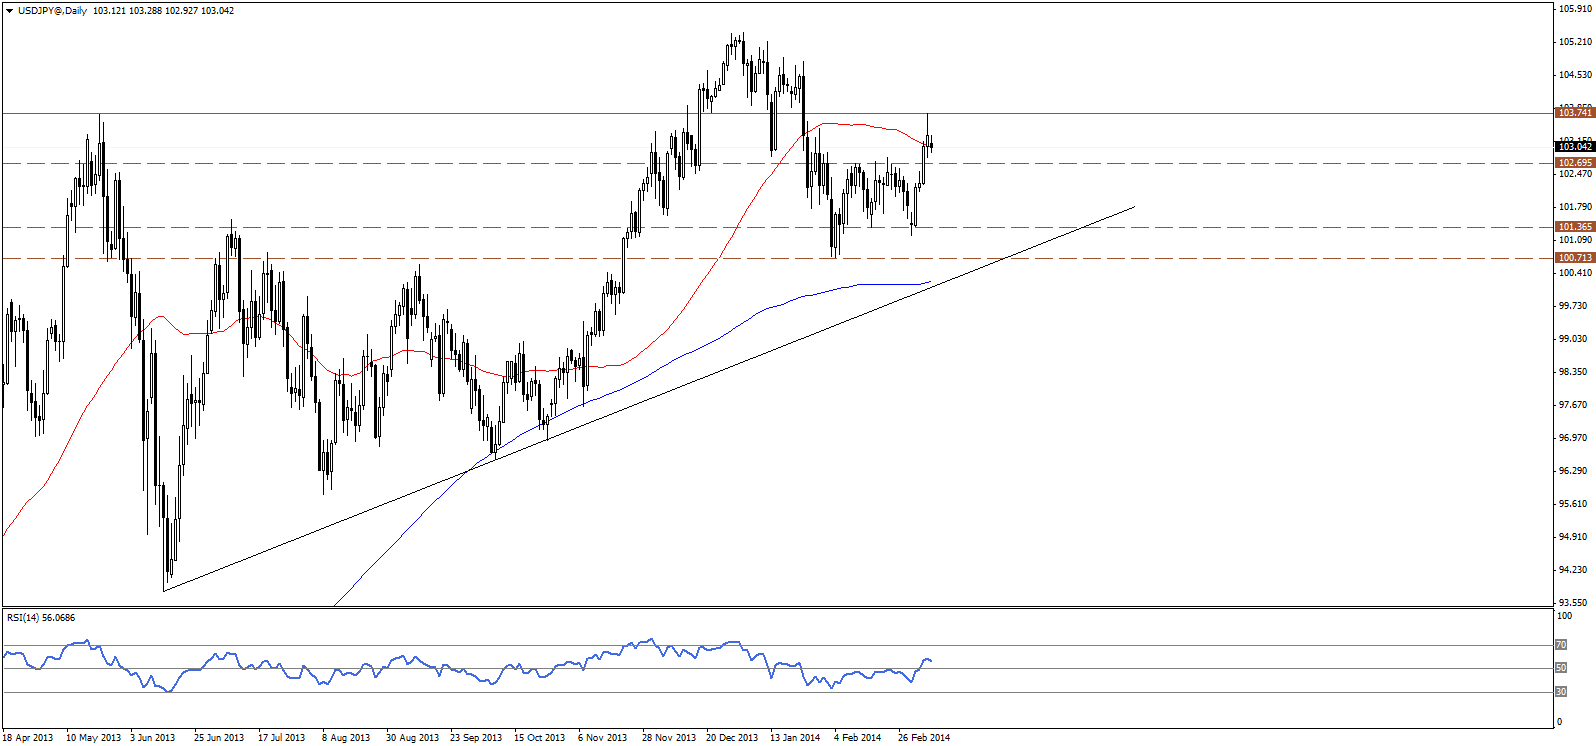
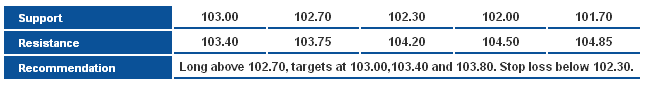
The USD/JPY retreats back lower after retesting 103.75 resistance level, the price is currently hovering around the 50-days SMA, meantime, it’s holding above 102.70 broken-resistance level which should hold for the bullish breakout to remain valid. Accordingly, the bullish scenario is favored this week as long as above 102.70, targeting a retest of 103.75 resistance again. A break with stability below 102.70 may signal more downside and sideways fluctuations.
 USD/JPY S&R Chart" title="USD/JPY S&R Chart" width="474" height="242">
USD/CHF
 USD/CHF Daily Chart" title="USD/CHF Daily Chart" width="474" height="242">
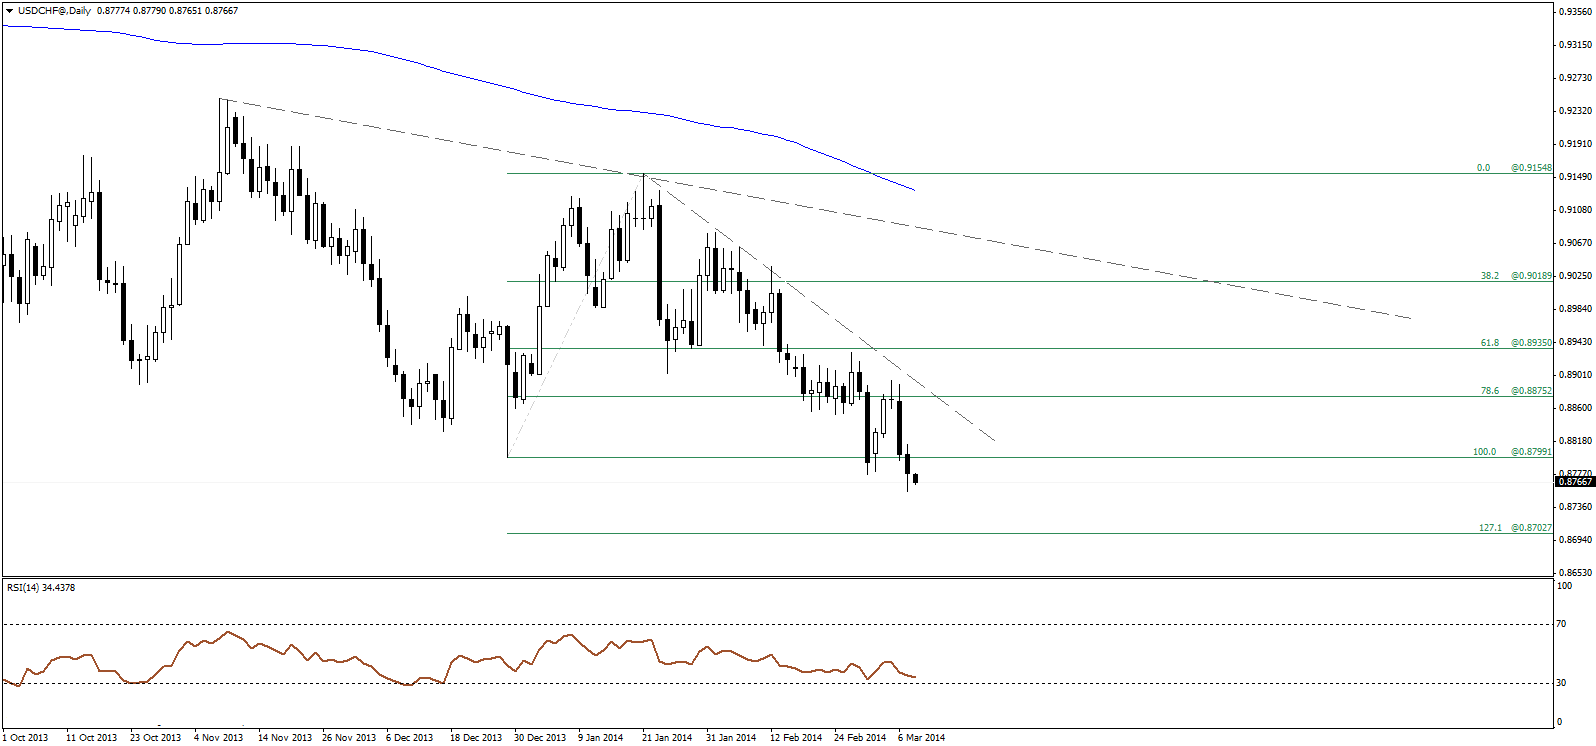
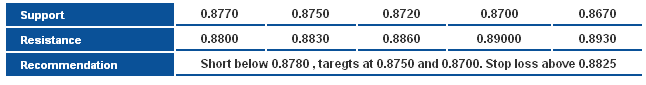
The USD/CHF extends the bearish wave, settling below the major swing low at 0.8800, and that hints the pair is probably heading lower, for a test of the 127.1 extension level for the latest main bullish correction, which resides around 0.8700 level. Overall, the bearish wave remains intact and should continue to be as long as below 0.8900.
 USD/CHF S&R Chart" title="USD/CHF S&R Chart" width="474" height="242">
USD/CAD
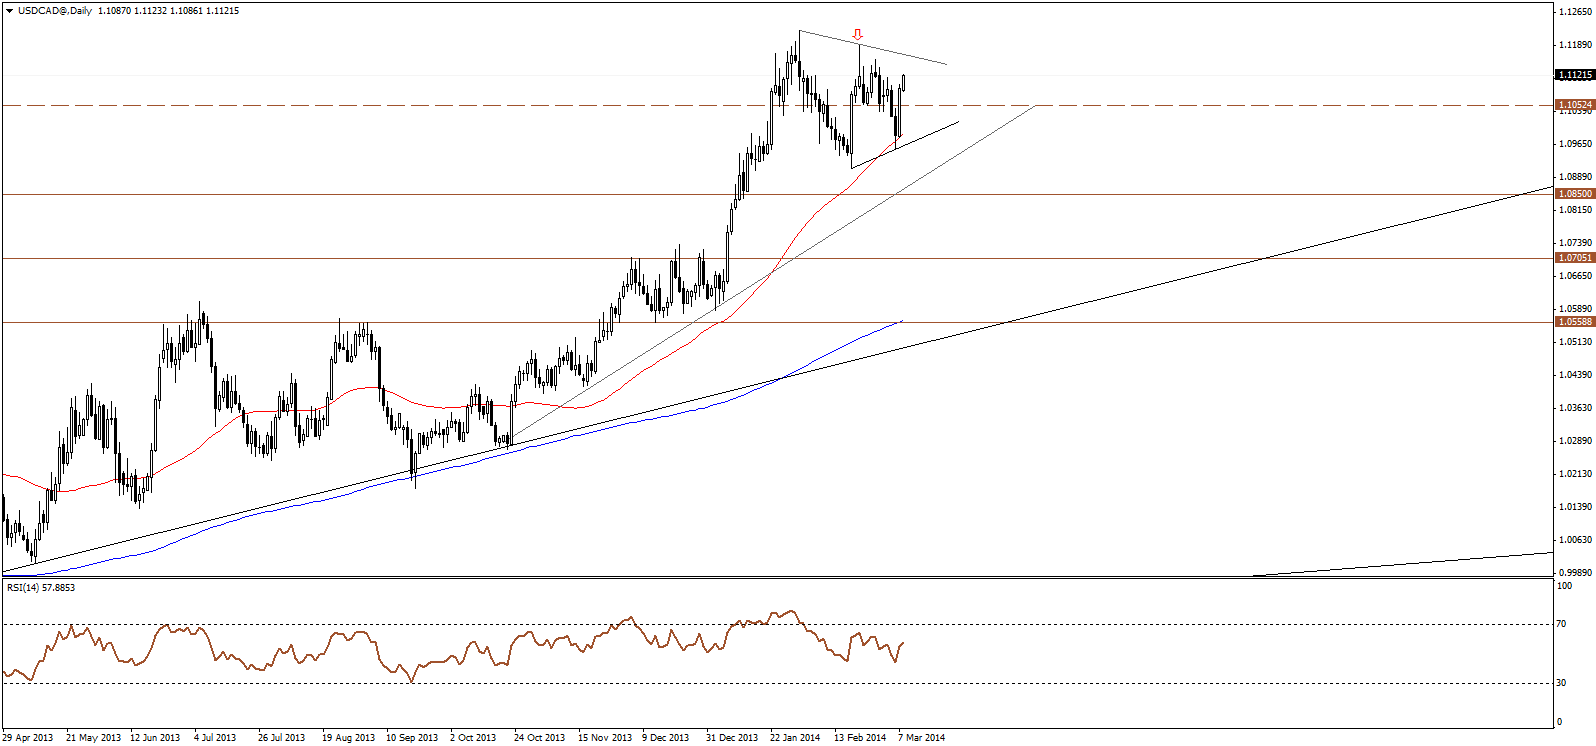 USD/CAD Daily Chart" title="USD/CAD Daily Chart" width="474" height="242">
The USD/CAD rebounded strongly of the 50-days SMA to break and settle back above 1.1050 resistance level, and that hints further upside is likely towards the minor descending resistance for the recent sideways correction. A break above the latest major high around 1.1220 should the continuation of the overall bull trend.
 USD/CAD S&R Chart" title="USD/CAD S&R Chart" width="474" height="242">
AUD/USD
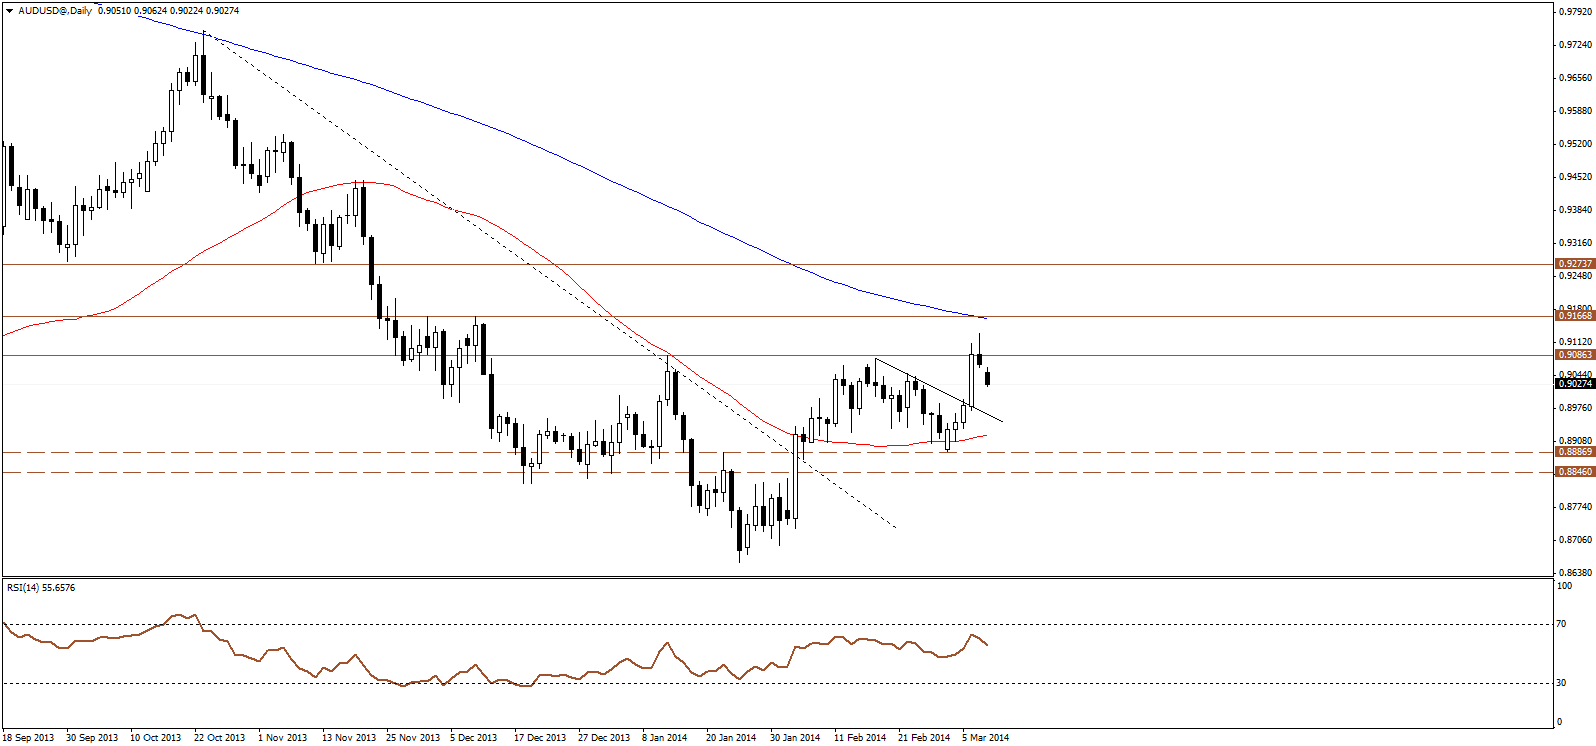 AUD/USD Daily Chart" title="AUD/USD Daily Chart" width="474" height="242">
The AUDUSD retreats sharply after hitting 0.9085 resistance level, as price formed a shooting star bearish candle on Friday, hinting a potential setback. For now, we may see further downside pressure within the context of the overall sideways range, and a retest of 0.8900 areas. Alternatively, a break with stability above 0.9100 may confirm a more prolonged bullish rebound.
 AUD/USD S&R Chart" title="AUD/USD S&R Chart" width="474" height="242">
NZD/USD
 NZD/USD Daily Chart" title="NZD/USD Daily Chart" width="474" height="242">
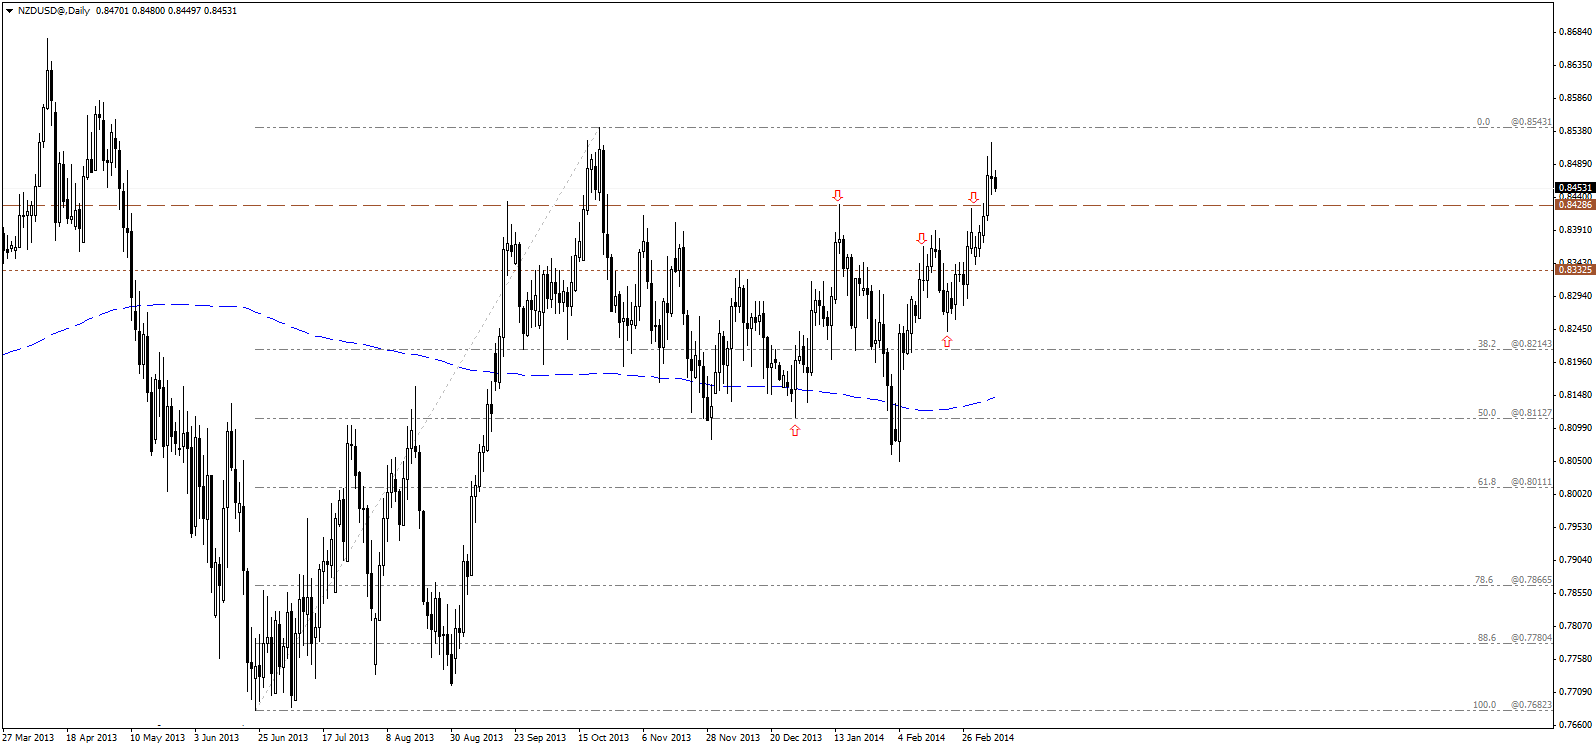
The NZD/USD was rejected on Friday, near the main resistance level at 0.8540, as price formed a long legged doji candle, hinting a potential pullback. Overall, the bullish wave is still intact, and price may find initial support at 0.8430 level and attempt to resume the bullish wave this week. Alternatively, stability back below 0.8400 may indicate more correctional bias.
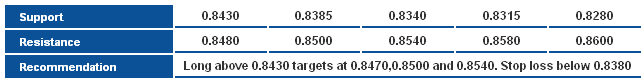 NZD/USDb S&R Chart" title="NZD/USDb S&R Chart" width="474" height="242">