EUR/USD
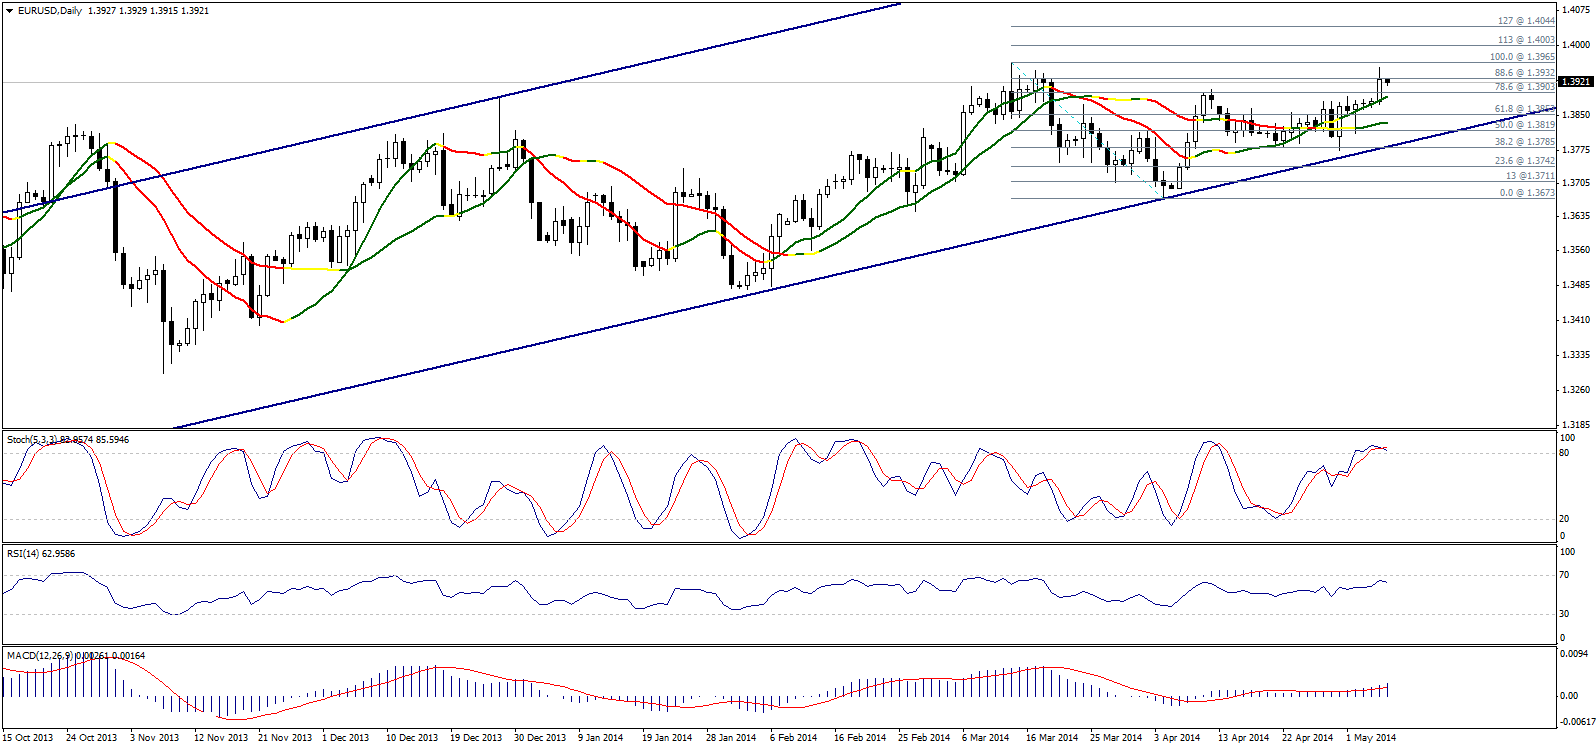
The pair inched higher yesterday and is trading above 1.3905 levels, as stabilizing above this level keeps the upside move valid. Stochastic is showing overbought signals which might lead to fluctuation and perhaps some bearish corrections. As long as the pair is stable above 1.3850, the bullish possibility remains valid.
Stability above 1.3935 supports the upside move and might push the pair towards 1.4005 then 1.4045 represented in 113% correction and 127.2% correction showing on graph.

GBP/USD
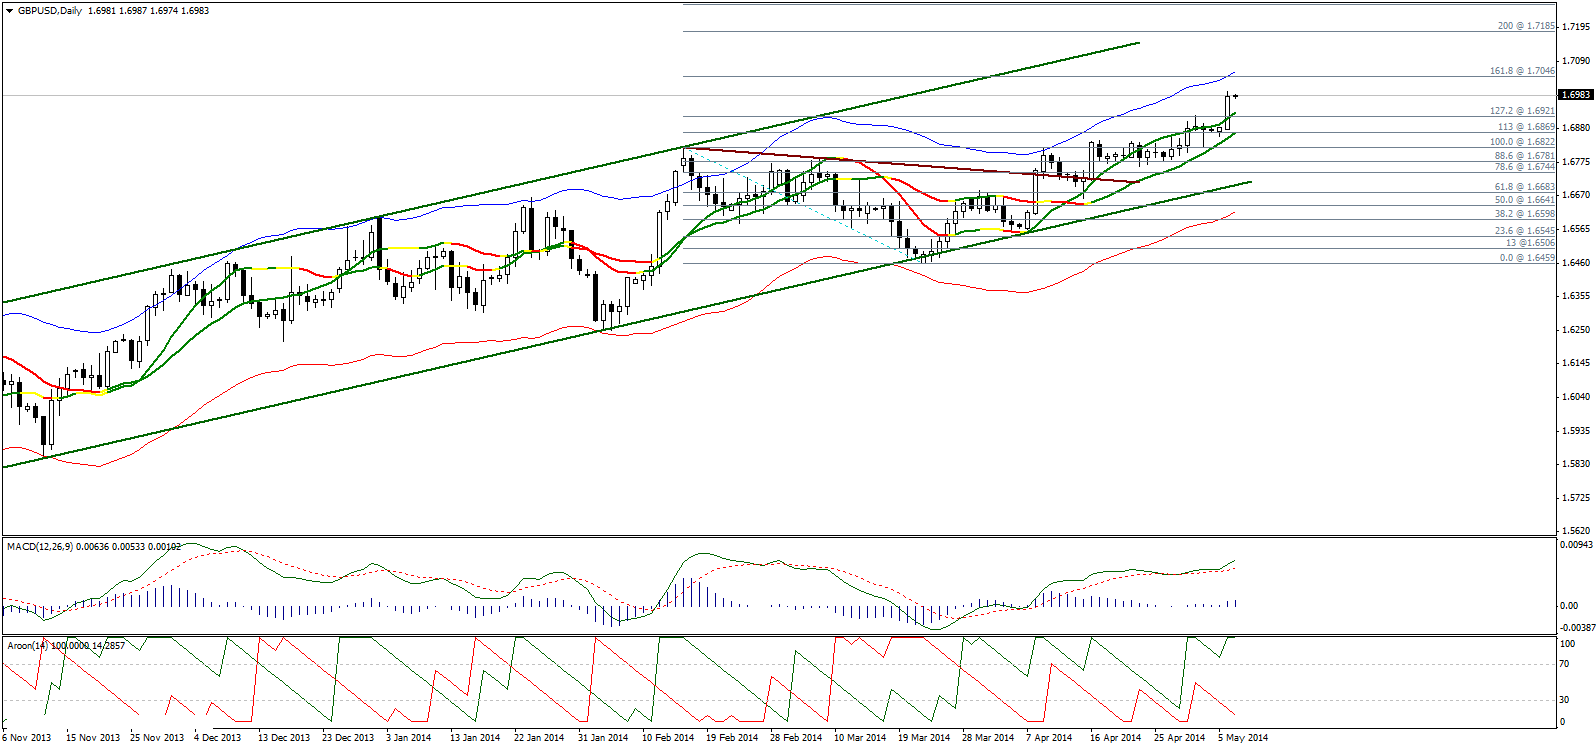
The pair witnessed a sharp upside move yesterday taking it to trade above 127.2% correction at 1.6920 levels. Stability above the referred to level extends the upside move in an attempt to test 1.7045, as the bullish extension requires breaching the latter which will be considered the pivotal resistance of the pair.
AROON and MACD are showing positivity as Linear Regression Indicators are trading positively forcing us to think that the upside move is valid in an attempt to test 161.8% correction at 1.7045 levels which is close to the upper line of Envelopes Indicator which its standard deviation was modified to 1.3%.

USD/JPY
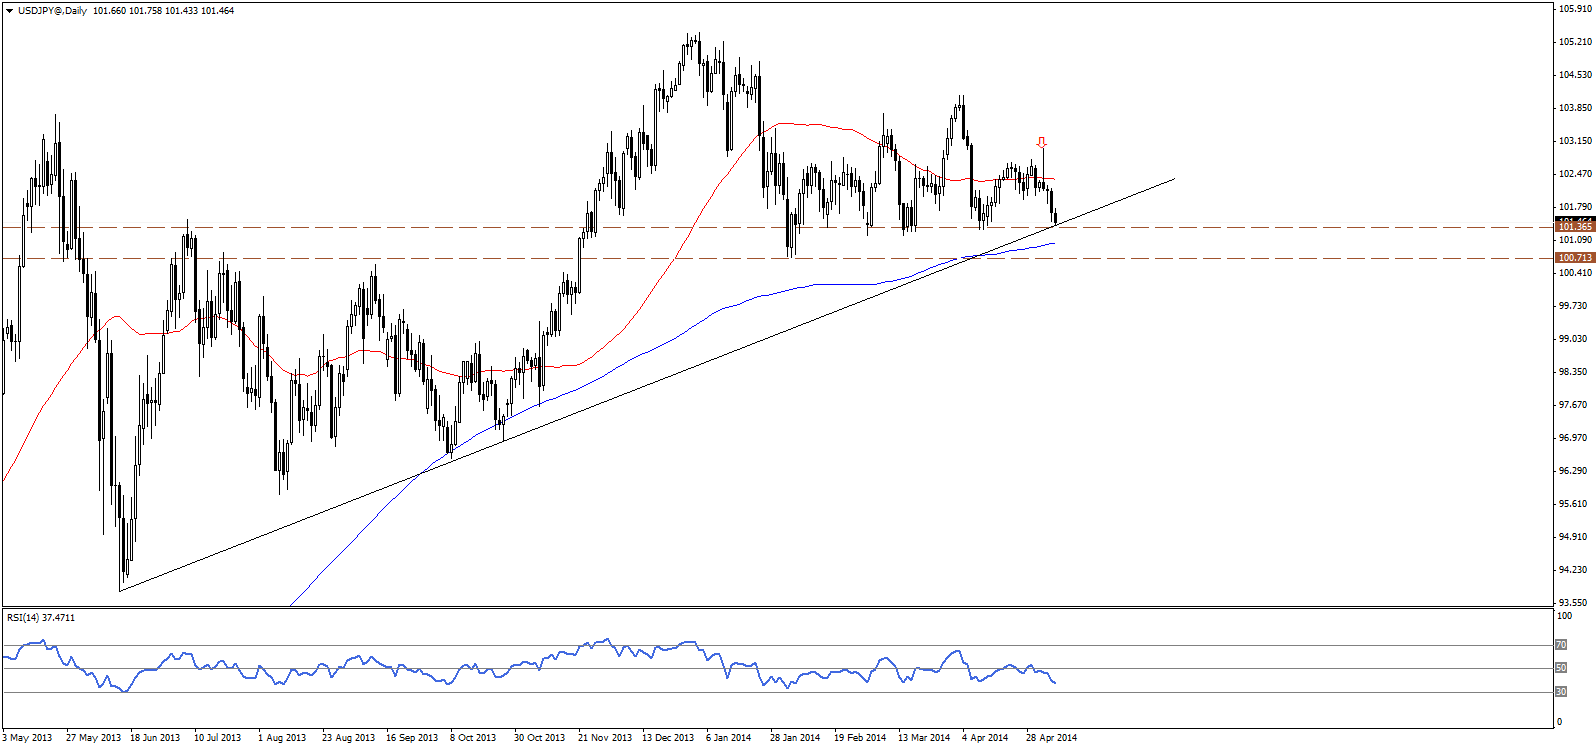
The USD/JPY ended yesterday’s session decisively lower, and remains under downside pressure with the start of today’s session, as price is retesting the main rising trend line shown on the daily chart above, in addition to the horizontal support at 101.30 area. Due to the importance of this support area we move to the sidelines, and wait for a confirmation of a downside break, or signs of a bullish rebound. A break below 101.30 will probably clear the way to the next support at the 200-days SMA and 100.70 horziontal support.

USD/CHF
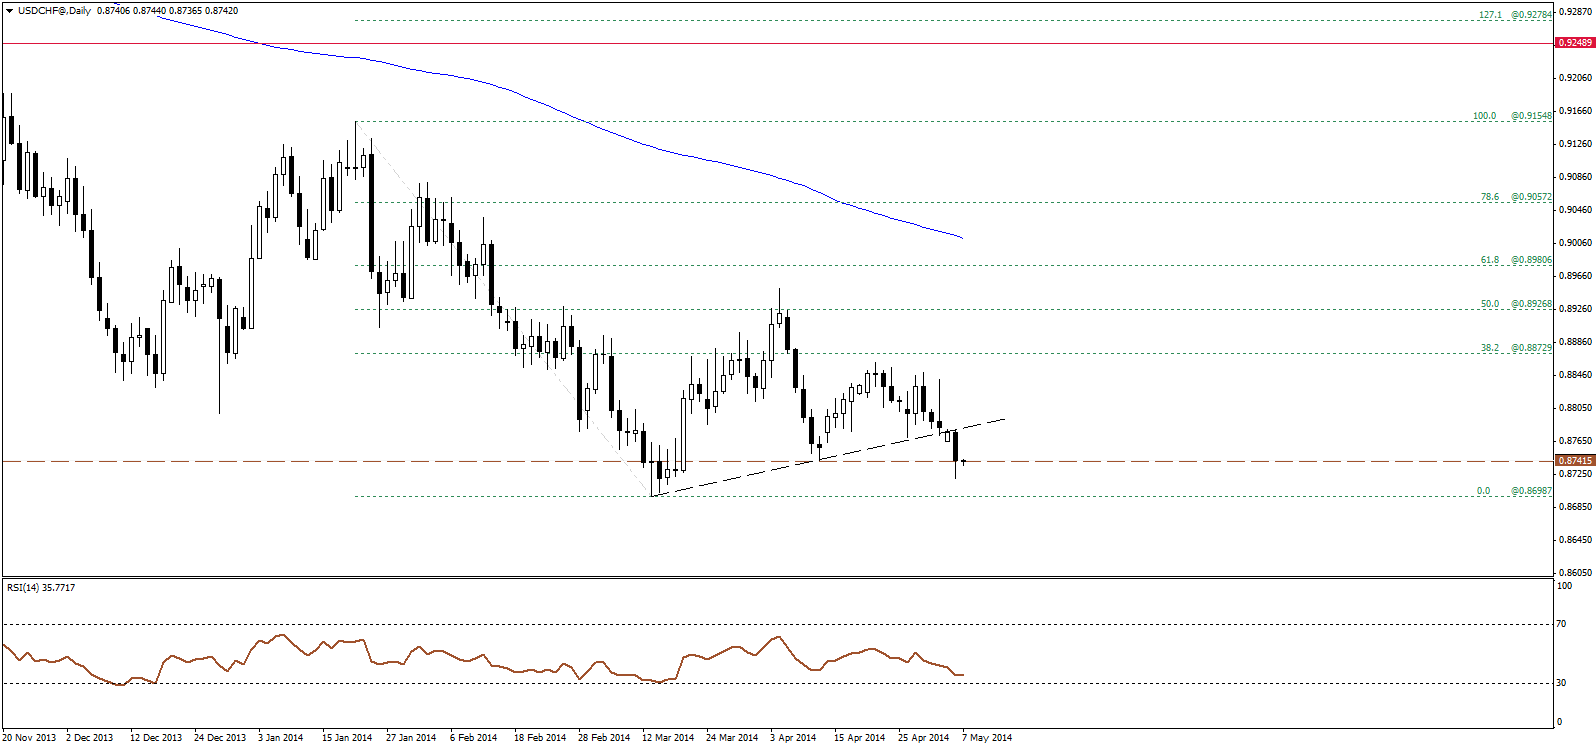
The USD/CHF extended the bearish move yesterday, currently hovering around 0.8740 horizontal support level, stability below 0.8840 will probably extend the downside towards the major low at 0.8699 level. Bearish bias continues to be favored, while Initial intraday resistance resides at 0.8770-0.8775.

USD/CAD
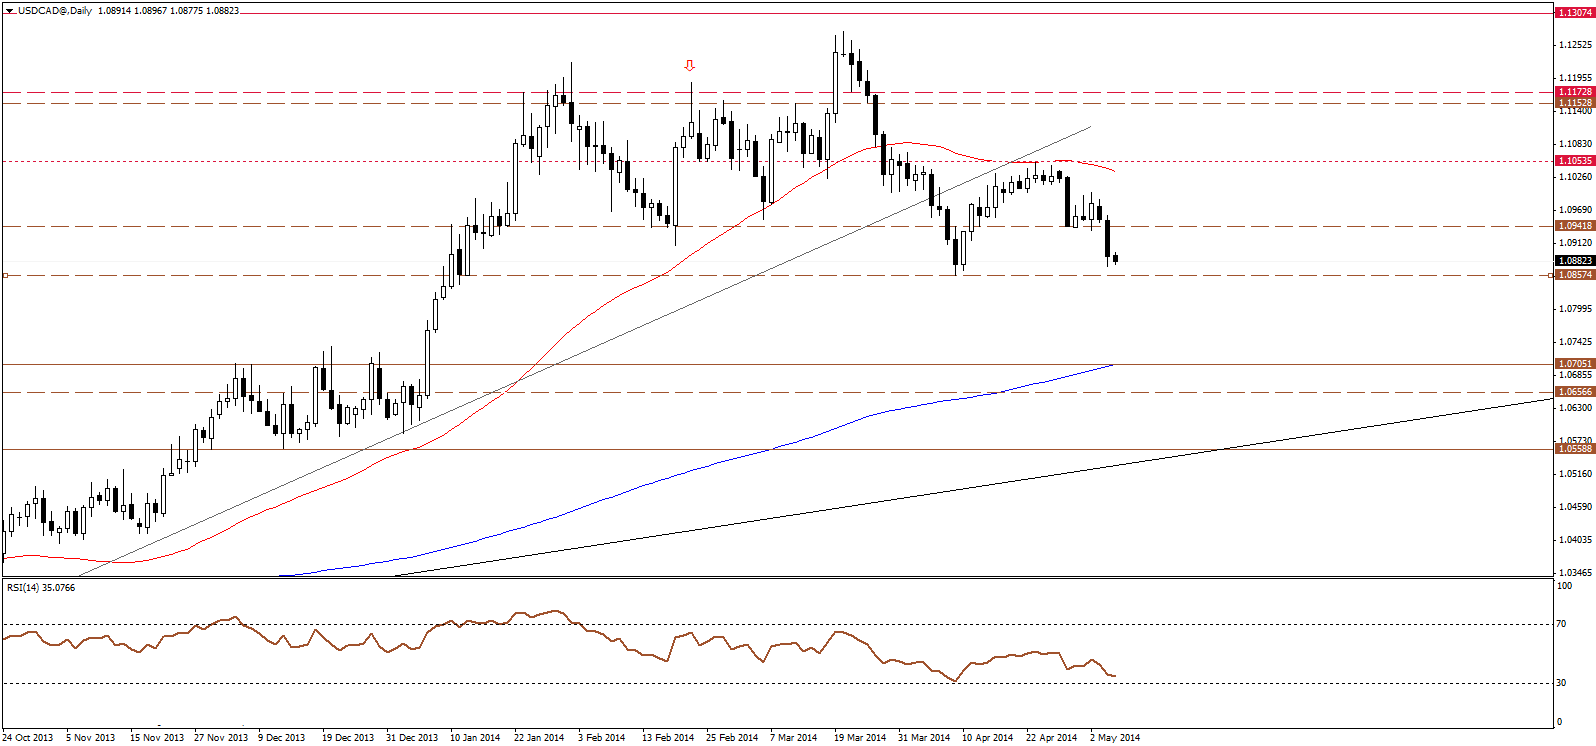
The USD/CAD extended the bearish wave, attempting to resume the main correctional wave that started from 1.1275 high, where price approached 1.0855 latest swing low and support level, a break below that support will probably confirm a move lower and a retest of areas around 1.0750. Holding below 1.0940 keeps the bearish bias favored over intraday basis.

AUD/USD
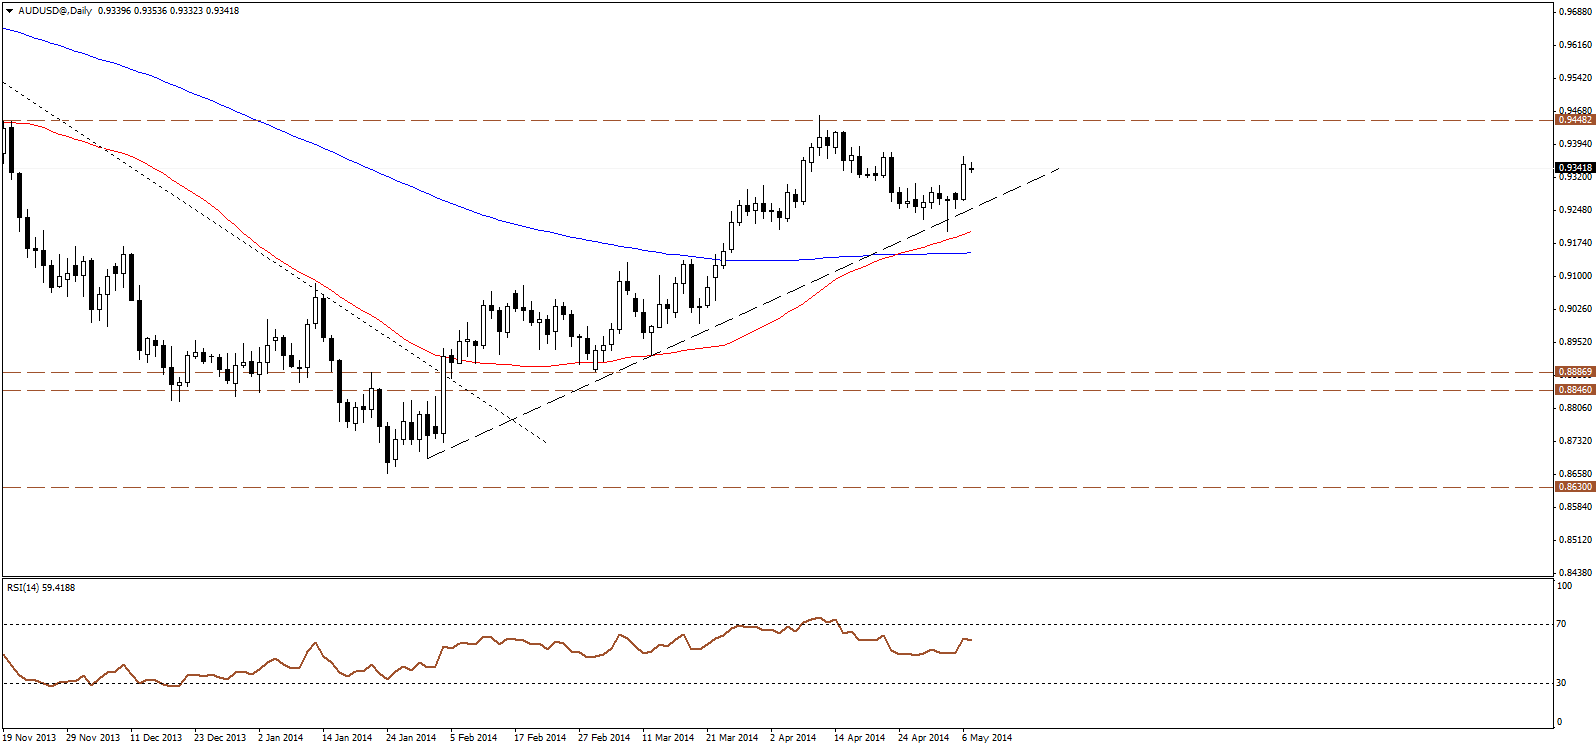
The AUD/USD is retracing slightly following yesterday’s sharp gains, where price hit 0.9370 level before founding resistance, however an pullback remains a buying opportunity as the bullish momentum remains dominant and expected to continue, targeting the main resistance level at 0.9450.

NZD/USD
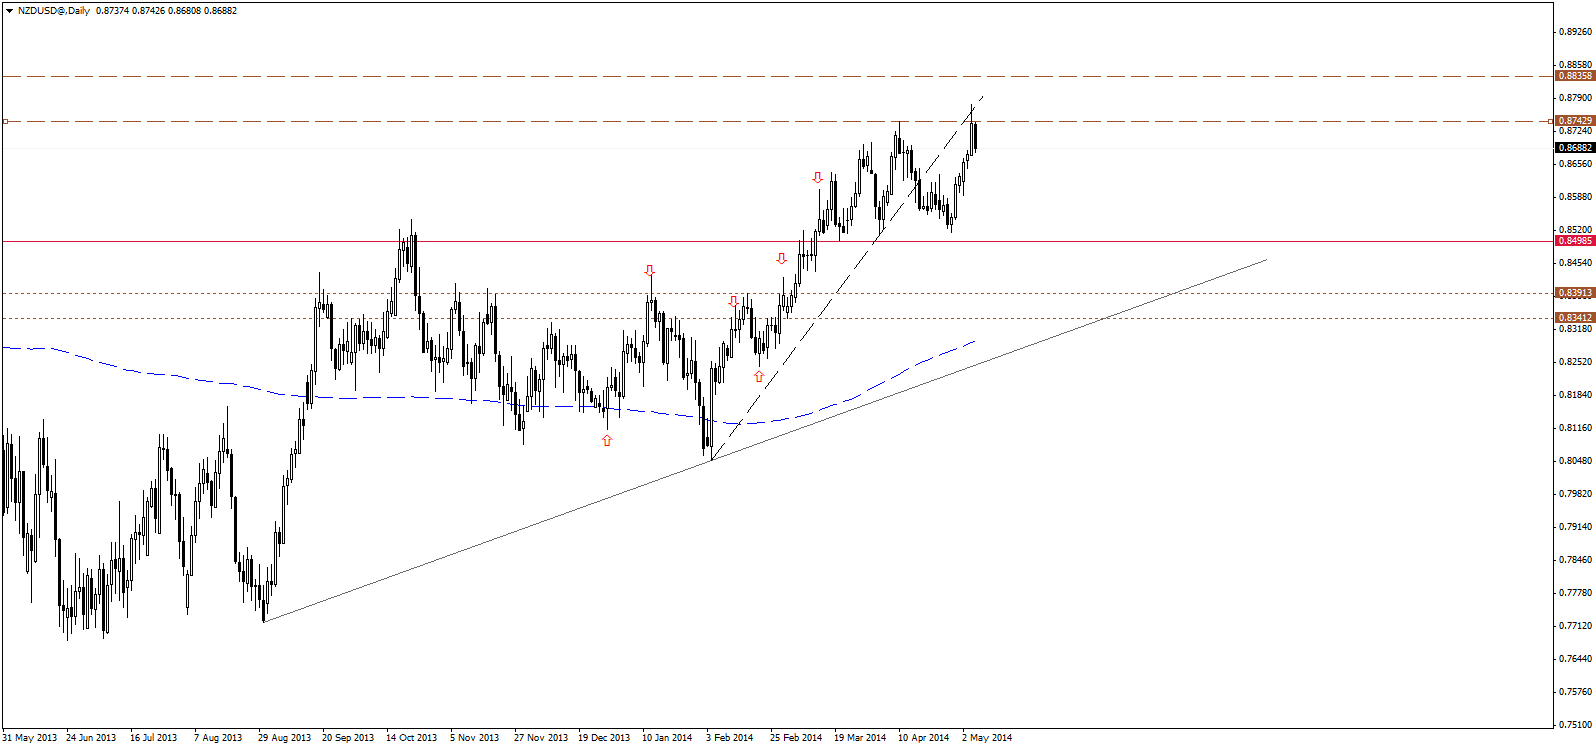
The NZD/USD rallied yesterday, hitting the latest major swing high at 0.8743 but failed to close the day higher. The rally has also retested the broken rising trend line shown on the daily chart above. Accordingly, we prefer to move to the sidelines for now, and wait for a confirmation for the continuation of the bullish wave. We will look for intraday bullish signs over the lower time intervals near 0.8690 support level, then 0.8640 if 0.8690 was breached.

