
EUR/USD - European Session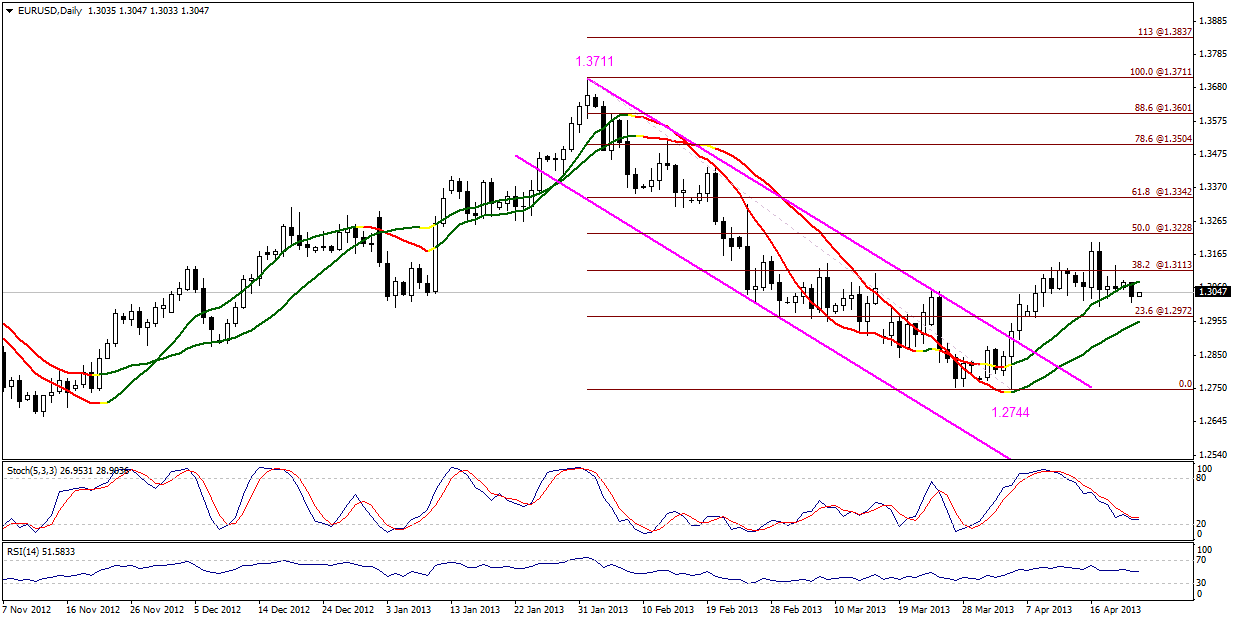 EUR/USD" title="EUR/USD" width="1233" height="618">
The EUR/USD pair dropped yesterday, and is trading below Linear Regression Indicator 34. Stability above 1.2970 levels maintains possible positivity again, as trading above 1.2970 triggers a new attempt to the upside supported by breaching key resistance level of the bearish move earlier.
The trading range for today is among the key support at 1.2905, and key resistance at 1.3185.
The general trend over short term basis is to the downside, targeting 1.2560 as far as areas of 1.3270 remain intact.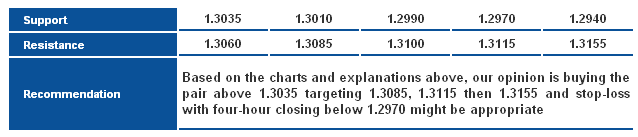 EUR/USD_S&R" title="EUR/USD_S&R" width="638" height="137">
GBP/USD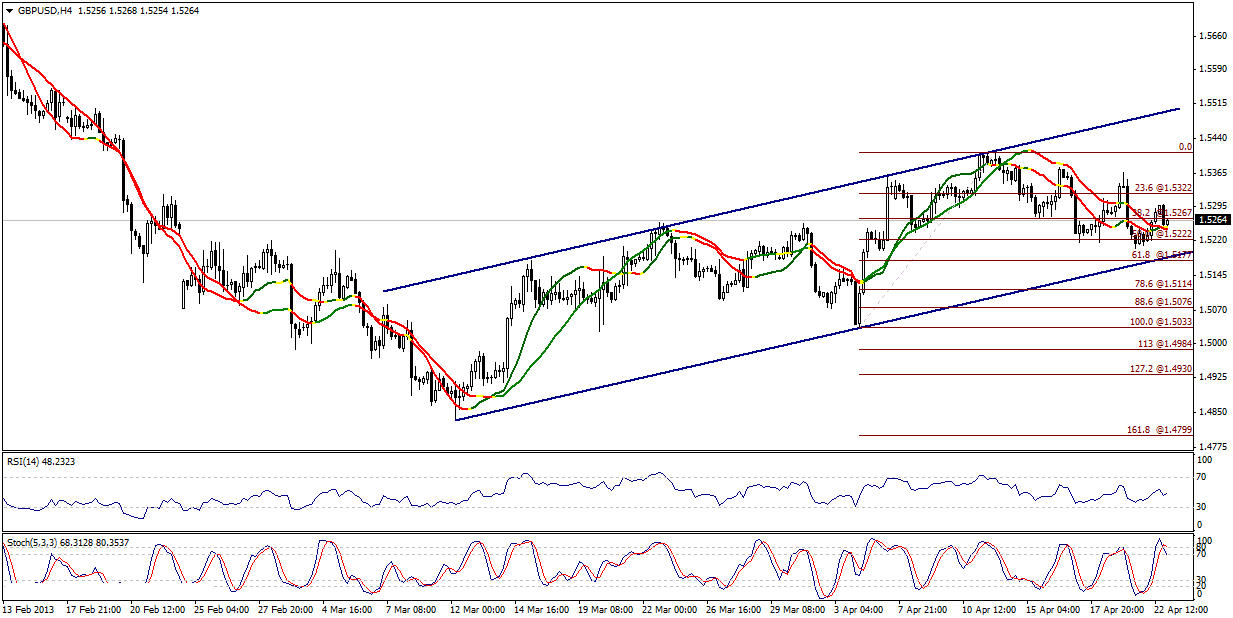 GBP/USD" title="GBP/USD" width="1233" height="618">
The GBP/USD pair rebounded to the upside yesterday affected by trading within an ascending channel, as indicated on the graph. Trading above 1.5190 and 1.5175 keeps the possibility of new attempts to the upside, especially with stabilizing above Linear Regression Indicatosr 34 and 55. Despite that, Stochastic is showing a negative crossover. The pair is stable below 1.5265, forcing us to neutrality in the European session, waiting for more confirmation signals.
The trading range for today is among key support at 1.5115, and key resistance at 1.5385.
The general trend over short term basis is to the downside, as far as areas of 1.6875 remain intact targeting 1.4225.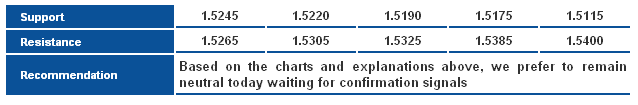 GBP/USD_S&R" title="GBP/USD_S&R" width="638" height="105">
USD/JPY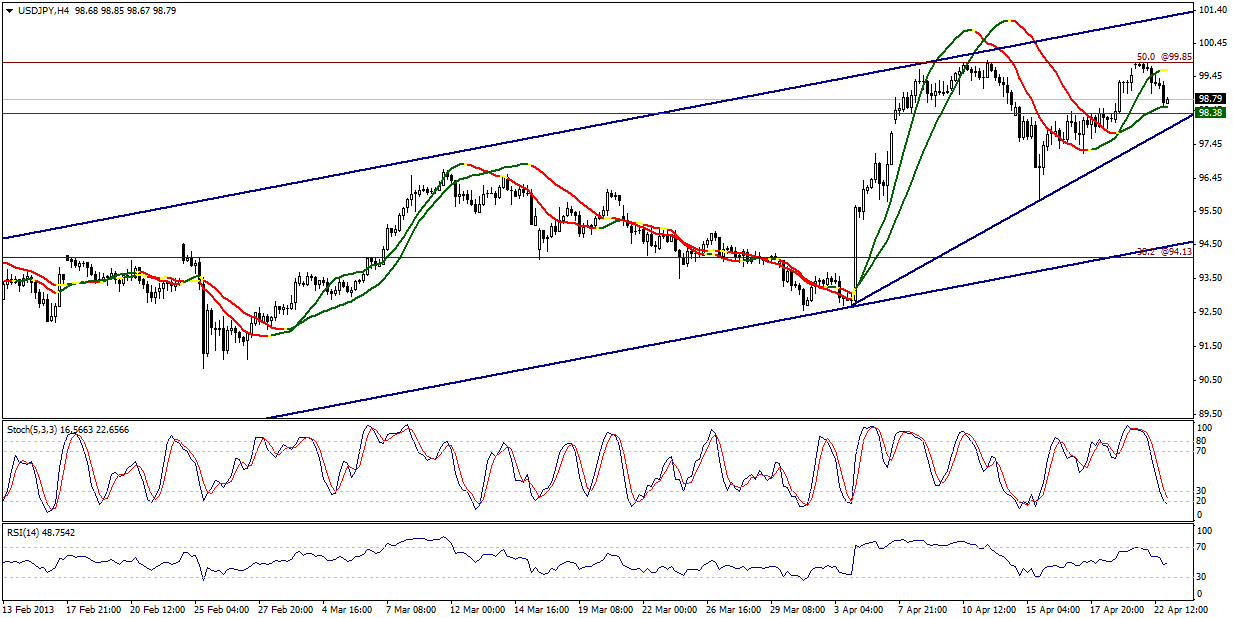 USD/JPY" title="USD/JPY" width="1233" height="618">
The USD/JPY pair dropped yesterday during the Asian session, but remained limited above Linear Regression Indicator 55 and above support level 98.35. Stability above these levels might trigger the upside move, but it cannot be confirmed before trading stable above 99.30. Breaking 97.85 levels will fail any attempt to the upside and a sharp bearish move.
The trading range for today is among key support at 96.70, and key resistance at 100.35.
The general trend over short term basis is to the upside, as far as areas of 84.00 remain intact targeting 100.00.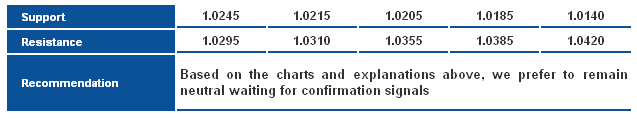 USD/JPY_S&R" title="USD/JPY_S&R" width="637" height="119">
USD/CHF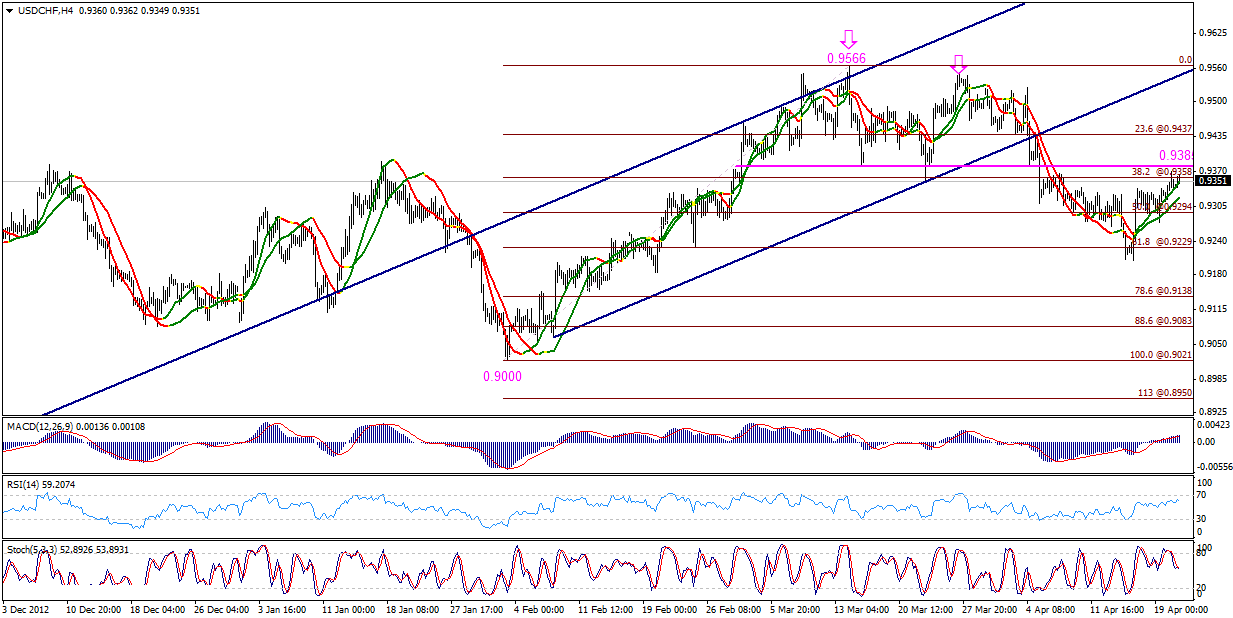 USD/CHF" title="USD/CHF" width="1233" height="618">
The USD/CHF pair is currently touching levels close to 38.2% correction at 0.9360, before the suggested neckline of the Double Top Pattern indicated on the graph at 0.9385. Risk/Reward Ratio might not be appropriate at these levels, as stability below 0.9360 might bring back the bearish move and the upside movements are only retesting the neckline. Trading below 0.9385 might bring back the bearish move.
The trading range for today is among key support at 0.9205, and key resistance at 0.9425.
The general trend over short term basis is to the downside, stable at levels 0.9775 targeting 0.8860.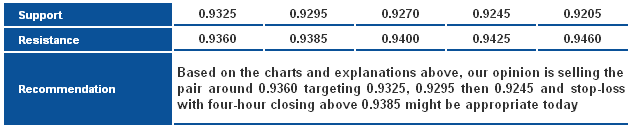 USD/CHF_S&R" title="USD/CHF_S&R" width="631" height="130">
USD/CAD USD/CAD" title="USD/CAD" width="911" height="662">
The pair is trading in a sideways range after the sharp rise earlier, the sideway trading is within a technical formation in the Symmetrical Triangle Pattern. There is an intraday technical contradiction on the pair; RSI tends to the downside while Stochastic is showing a positive crossover. The pair is trading below Linear Regression Indicator 34, forcing us to prefer neutrality.
The trading range for today is between the key support at 1.0185, and the key resistance at 1.0355.
The general trend over short term basis is to the upside, with steady daily closing above levels 0.9800 targeting 1.0485.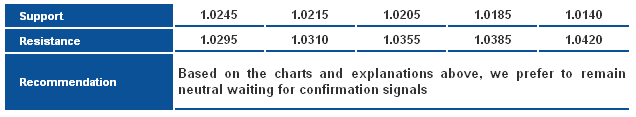 USD/CAD_S&R" title="USD/CAD_S&R" width="636" height="117">
AUD/USD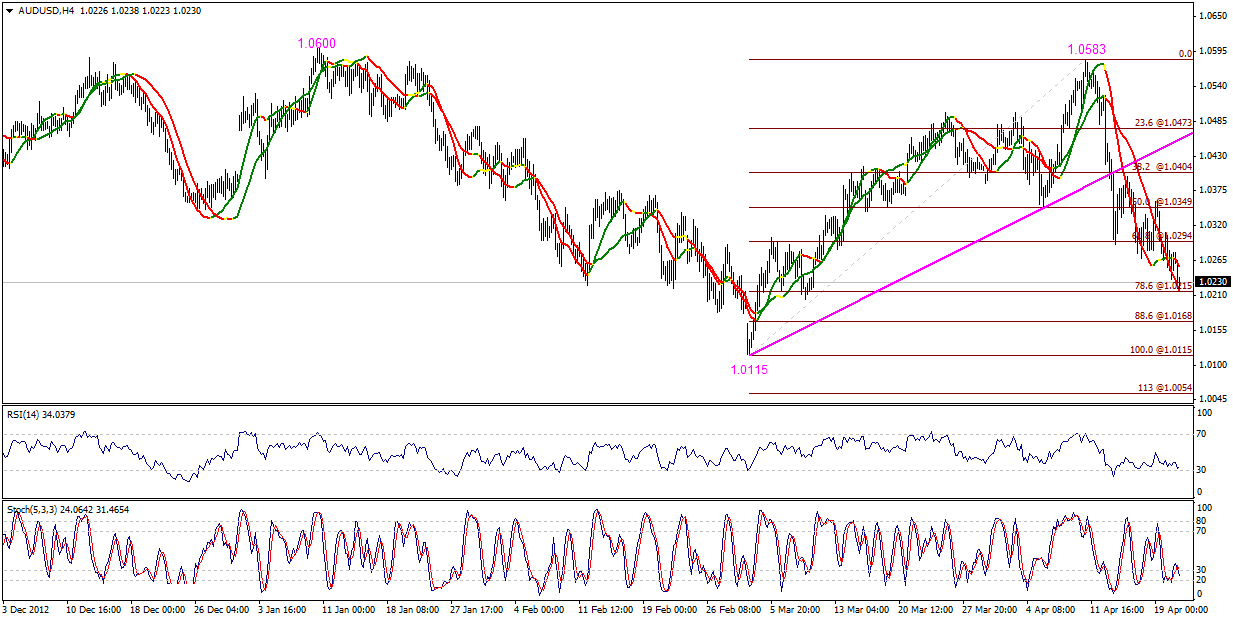 AUD/USD" title="AUD/USD" width="1233" height="618">
The AUD/USD dropped to 78.6% correction at 1.0215; the overall downtrend has continued since the pair touched the top at 1.0583. Linear Regression Indicators are inclined to negativity, which could force the extension of the downtrend. The stability below 1.0295 maintains chances for intraday negativity.
Trading range expected today is between the key support at 1.0135, and the key resistance 1.0355.
Short-term trend is to the downside, targeting 0.9400 if 1.0710 remains intact.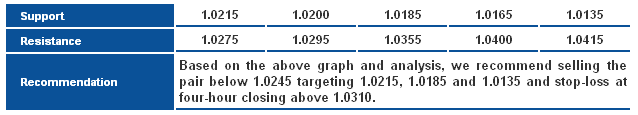 AUD/USD_S&R" title="AUD/USD_S&R" width="638" height="115">
NZD/USD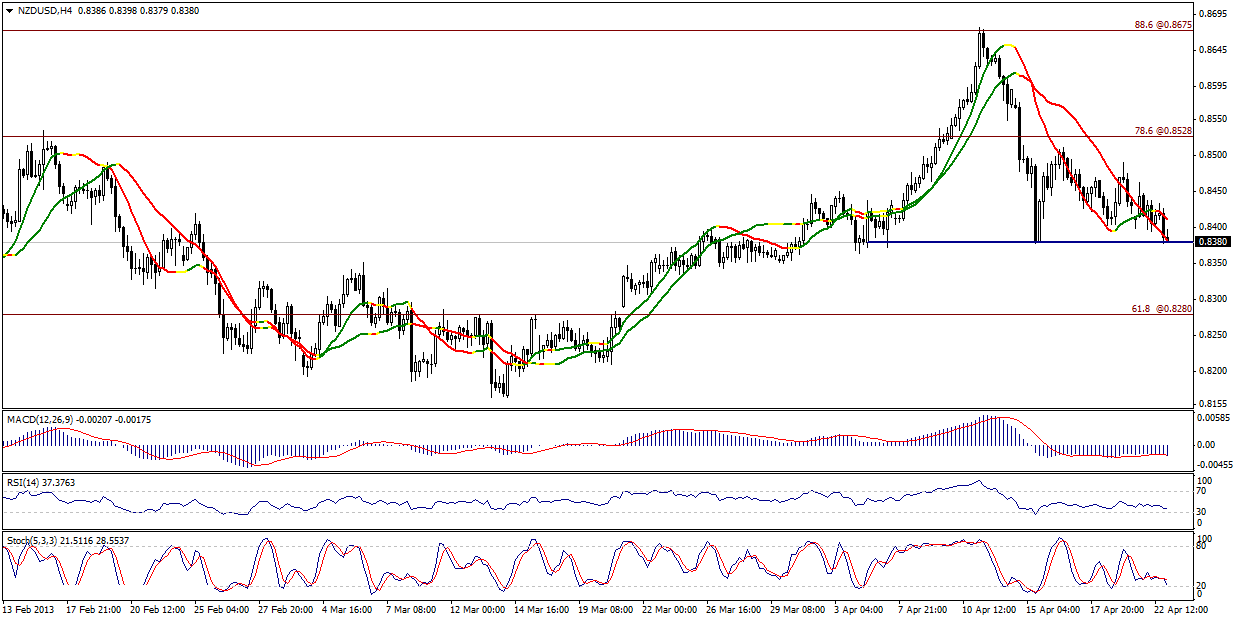 NZD/USD" title="NZD/USD" width="1233" height="618">
The NZD/USD stands at crucial intervals that could trigger a new bearish wave if broken. 0.8375 is our primary key interval, stability below which could send the pair plummeting towards levels of around 0.8280.
Trading range expected today is between the key support at 0.8280, and the key resistance of 0.8485.
Short-term trend is upside, targeting 0.8845 if 0.8130 remains intact.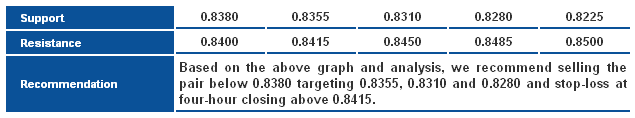 NZD/USD_S&R" title="NZD/USD_S&R" width="635" height="118">
GBP/JPY GBP/JPY" title="GBP/JPY" width="911" height="662">
The GBP/JPY pair has formed a minor double top pattern over hourly basis, currently attempting to break the ascending trend line for the latest bullish wave as indicated on the chart. A break below the trend line could negate the short-term bullish bias, and confirms a sideways price action for a possible retest of the 148.00 level. We will monitor the price around this level for confirmation for the next move.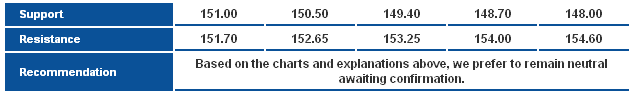 GBP/JPY_S&R" title="GBP/JPY_S&R" width="637" height="100">
EUR/JPY EUR/JPY" title="EUR/JPY" width="911" height="662">
The EURJPY pair has broken the horizontal support at 129.70, followed by 128.80 in addition to breaking the short term ascending trend line shown above. A continuation of the bearish bias is likely, targeting a move towards the bottom of the range near 126.50 and 126.00 key support levels.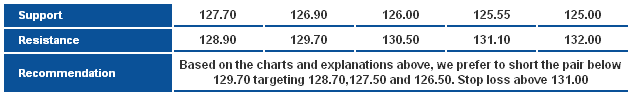 EUR/JPY_S&R" title="EUR/JPY_S&R" width="632" height="99">
EUR/GBP EUR/GBP" title="EUR/GBP" width="911" height="662">
The EUR/GBP retreated after testing the 0.8600 resistance area. The pair has been hovering below the level for a while, and that keeps the bearish scenario intact. A repeated break below 0.8500 level is needed to accelerate the bearish bias. On the other hand, holding below 0.8650 is required for this scenario to remain valid.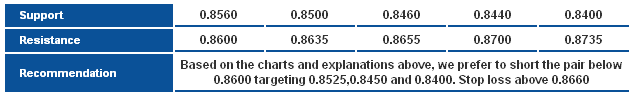 EUR/GBP_S&R" title="EUR/GBP_S&R" width="634" height="96">
- English (UK)
- English (India)
- English (Canada)
- English (Australia)
- English (South Africa)
- English (Philippines)
- English (Nigeria)
- Deutsch
- Español (España)
- Español (México)
- Français
- Italiano
- Nederlands
- Português (Portugal)
- Polski
- Português (Brasil)
- Русский
- Türkçe
- العربية
- Ελληνικά
- Svenska
- Suomi
- עברית
- 日本語
- 한국어
- 简体中文
- 繁體中文
- Bahasa Indonesia
- Bahasa Melayu
- ไทย
- Tiếng Việt
- हिंदी
Daily Technical Report: Major And Cross Currencies - April 23, 2013
Published 04/23/2013, 04:23 AM
Updated 07/09/2023, 06:31 AM
Daily Technical Report: Major And Cross Currencies - April 23, 2013
3rd party Ad. Not an offer or recommendation by Investing.com. See disclosure here or
remove ads
.
Latest comments
Install Our App
Risk Disclosure: Trading in financial instruments and/or cryptocurrencies involves high risks including the risk of losing some, or all, of your investment amount, and may not be suitable for all investors. Prices of cryptocurrencies are extremely volatile and may be affected by external factors such as financial, regulatory or political events. Trading on margin increases the financial risks.
Before deciding to trade in financial instrument or cryptocurrencies you should be fully informed of the risks and costs associated with trading the financial markets, carefully consider your investment objectives, level of experience, and risk appetite, and seek professional advice where needed.
Fusion Media would like to remind you that the data contained in this website is not necessarily real-time nor accurate. The data and prices on the website are not necessarily provided by any market or exchange, but may be provided by market makers, and so prices may not be accurate and may differ from the actual price at any given market, meaning prices are indicative and not appropriate for trading purposes. Fusion Media and any provider of the data contained in this website will not accept liability for any loss or damage as a result of your trading, or your reliance on the information contained within this website.
It is prohibited to use, store, reproduce, display, modify, transmit or distribute the data contained in this website without the explicit prior written permission of Fusion Media and/or the data provider. All intellectual property rights are reserved by the providers and/or the exchange providing the data contained in this website.
Fusion Media may be compensated by the advertisers that appear on the website, based on your interaction with the advertisements or advertisers.
© 2007-2024 - Fusion Media Limited. All Rights Reserved.