
EUR/USD
 EUR/USD" title="EUR/USD" width="926" height="610">
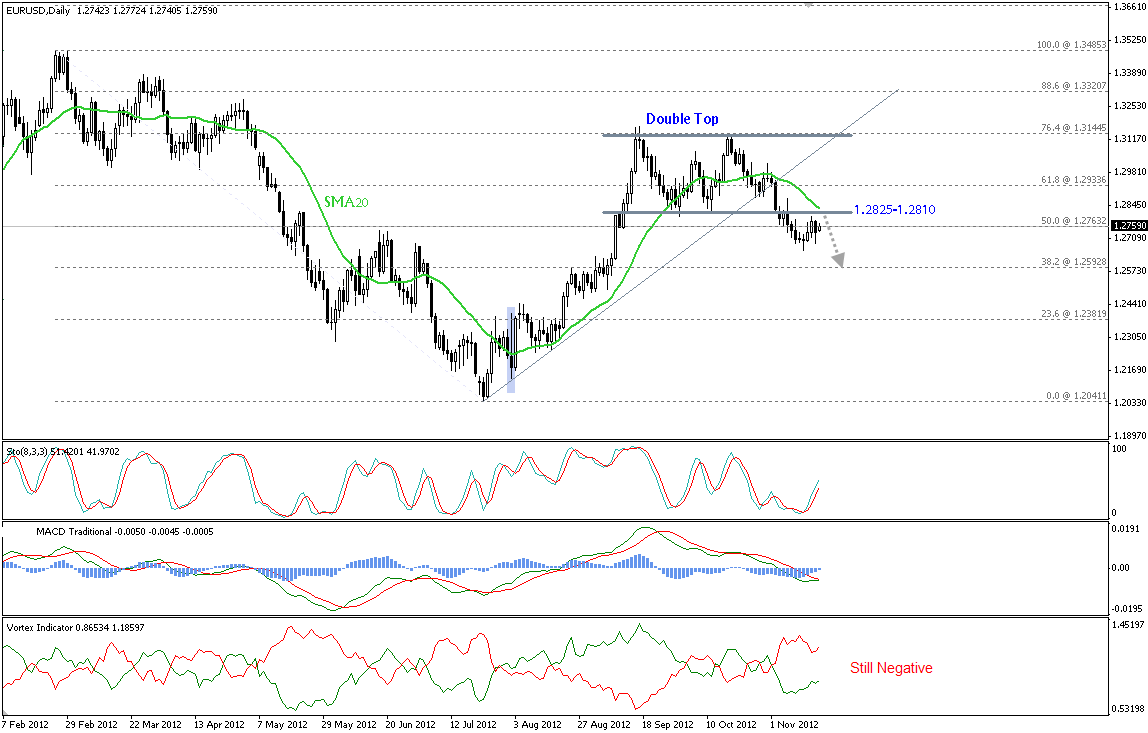
 The EUR/USD pair has consolidated below the previous broken neckline of our detected double top pattern for the most of the previous week as seen on the provided daily chart. SMA 20 should add additional strength for the aforesaid resistance to keep the classical pattern valid as well. Having said so, we still see chances for potential downside movements during this week mainly targeting 1.2590 boundaries; a sustained breakout above 1.2890 areas will shift the bias to neutral.
The trading range for this week is among key support at 1.2500 and key resistance at 1.3000.
The general trend over the short-term is to the downside targeting 1.1865 as far as areas of 1.3550 remain intact.  EUR/USD_S&R" title="EUR/USD_S&R" width="684" height="96">
GBP/USD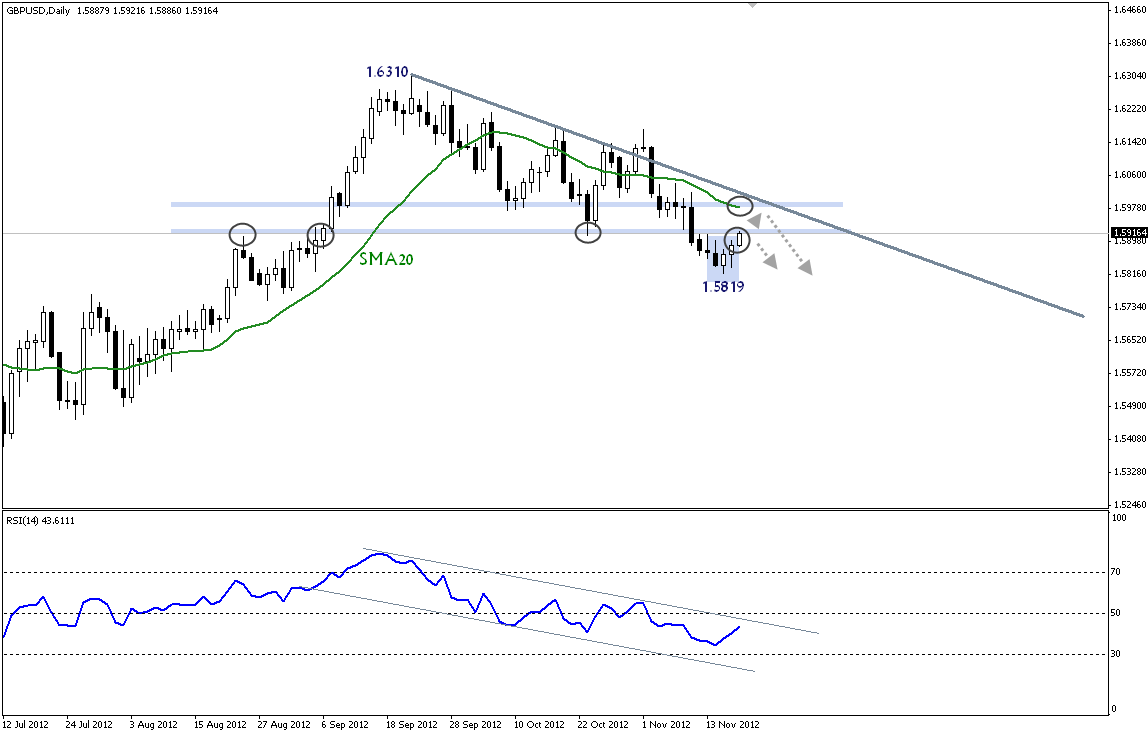 GBP/USD" title="GBP/USD" width="926" height="610">
The pair has fallen sharply below its 200-day moving average during the previous period, finding modest support at 1.5820 pivotal support regions as seen on the provided daily chart. The recent mild bounce from the aforementioned support has alleviated the oversold condition on RSI 14 indicator but we still can notice that a bearish momentum channel has been drawn on the indicator. To recap, the current retracement should be well-capped below 1.60 figure while re-visiting 1.58 territories followed by 1.5740 will be likely in the cards.
The trading range for this week is among key support at 1.5630 and key resistance at 1.6180.
The general trend over the short-term is to the downside targeting 1.4225 as far as areas of 1.6875 remain intact.  GBP/USD_S&R" title="GBP/USD_S&R" width="684" height="95">
USD/JPY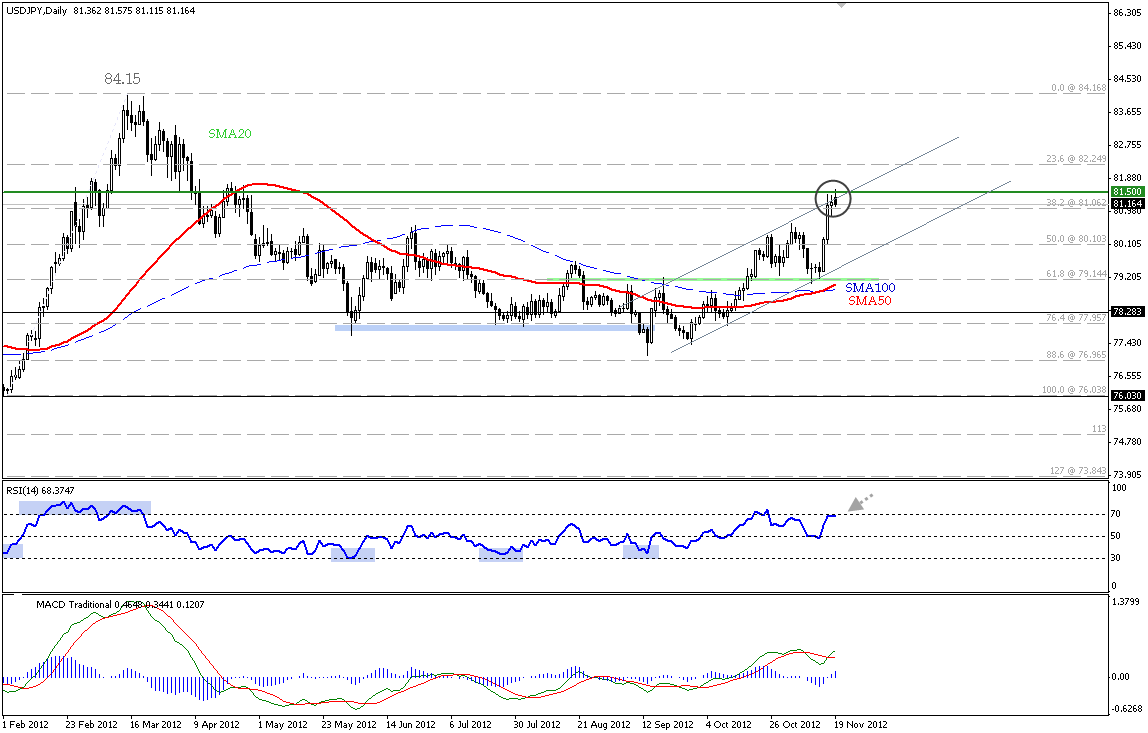 USD/JPY" title="USD/JPY" width="926" height="610">
Following the sharp inclines that took the USD/JPY pair towards the initial resistance level of 81.50, we have witnessed a technical pause start last Thursday. The sensitivity of the current trading level in addition to the overbought condition on RSI 14 forces us to stand aside until the pair proves its ability to take out 81.50 areas; noting that risk versus reward ratio is very high. Finally, a daily closing above 81.50 will assist traders to challenge 82.25 and probably 84.15 in the near term.
The trading range for this week is among key support at 79.60 and key resistance now at 82.80.
The general trend over the short-term is to the upside targeting 87.45 as far as areas of 75.20 remain intact. 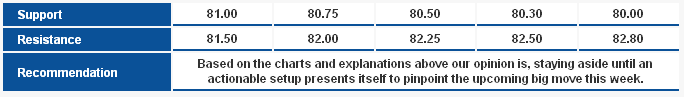 USD/JPY_S&R" title="USD/JPY_S&R" width="684" height="97">
USD/CHF USD/CHF" title="USD/CHF" width="926" height="610">
Areas of 0.9400 halted the upside move and trading today started with a downside bias; this signals that the bearish Butterfly Pattern continues to influence trading and might extend the downside pressure on the pair. Breaching 0.9570 will completely fail the pattern and extend the upside move, while stability below 0.9515 supports the completion of the pattern as provided on the chart.
The trading range for this week is among the key support at 0.9245 and key resistance at 0.9655.
The general trend over the short-term is to the downside targeting 0.8860 as far as areas of 0.9775 remains intact. 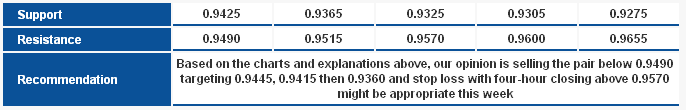 USD/CHF_S&R" title="USD/CHF_S&R" width="686" height="110">
USD/CAD USD/CAD" title="USD/CAD" width="926" height="610">
The bearish Butterfly Pattern controls trading and we can see that the upside move seen was limited below 1.0040 over four-hour basis which keeps the pattern intact. We expect new downside attempts and a possible test to 0.9920 areas which if breached will extend the downside move toward 0.9850. Stochastic signals lower and RSI is gradually losing the upside momentum.
The trading range for this week is among the key support at 0.9730 and key resistance at 1.0185.
The short-term trend is expected to the downside with daily closing below 1.0125 targeting areas of 0.9400. 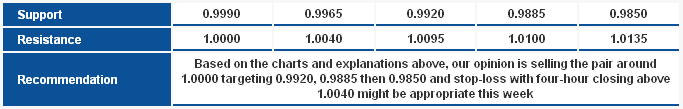 USD/CAD_S&R" title="USD/CAD_S&R" width="683" height="109">
AUD/USD AUD/USD" title="AUD/USD" width="926" height="610">
After reaching the first Potential Reversal Zone (PRZ) at 1.0290 the pair returned sharply higher affected by the bullish Butterfly Pattern expected earlier. This upside move remained limited below the previously breached main ascending support and Stochastic reflects overbought signals; the Linear Regression Indicators are also trading negatively but the pair is stable above them. We now need confirmations for the next move as the bullish Butterfly Pattern conflicts with the breach of the ascending support and therefore our weekly outlook is neutral waiting for more confirmations for the next move.
The trading range for this week is expected among the key support at 1.0165 and resistance at 1.0505.
The short-term trend is to the downside targeting 0.9400 with steady daily closing below 1.0710. 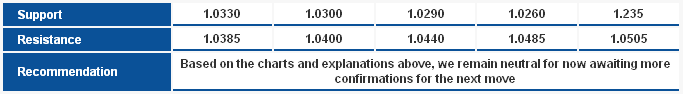 AUD/USD_S&R" title="AUD/USD_S&R" width="683" height="94">
NZD/USD NZD/USD" title="NZD/USD" width="926" height="610">
The pair returned above 0.8100, but at the same time continues to trade below the Linear Regression Indicators and accordingly we will stay aside . Stability below 0.8100 is essential to support the downside move, but at the same time we cannot favor the upside move as the pair is below the Linear Regression Indicators and the ascending support provided on the chart.
The trading range for this week is expected among the key support at 0.7985 and resistance at 0.8355.
The short-term trend is to the upside targeting 0.8400 with steady daily closing above 0.7930. 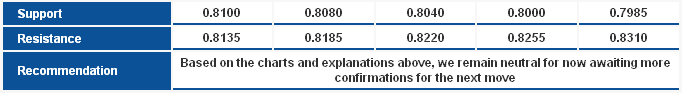 NZD/USD_S&R" title="NZD/USD_S&R" width="682" height="93">
Technical Crosses
GBP/JPY GBP/JPY" title="GBP/JPY" width="926" height="610">
The pair surged to trade again above the first extended target of the bullish Harmonic Bat Pattern. This move could support further upside actions to test the minor resistance at 88.6% correction at 130.35 and might extend toward "C" top at 131.85. Stochastic offers overbought signs which might cause volatility and probably some bearish correction, however, trading above 128.25 will maintain the bullish wave intact.
The trading range expected for this week is between the key support at 125.30 and the key resistance at 131.85 .
The short-term trend is to the downside targeting 112.00 as far as 150.00 remains intact.  GBP/JPY_S&R" title="GBP/JPY_S&R" width="686" height="110">
EUR/JPY EUR/JPY" title="EUR/JPY" width="926" height="610">
The pair rose again approaching the resistance level around 104.60. Breaching that level could cause the pair to surge to the upside to complete forming the BC leg of a suggested Harmonic Shark or 0-5 Harmonic pattern. Stochastic is currently in overbought areas hindering a bullish wave for some time, however, by simply breaching the mentioned resistance level, the pair could enter a new upside wave.
The trading range expected for this week is between the key support at 100.75 and the key resistance 106.25
The short-term trend is to the upside targeting 109.15 as far as 98.75 remains intact. 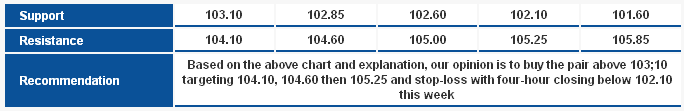 EUR/JPY_S&R" title="EUR/JPY_S&R" width="684" height="111">
EUR/GBP EUR/GBP" title="EUR/GBP" width="926" height="610">
The pair returned to trade below 0.8030 after failing to breach the 0.8070 level, which gives a strong probability that the upside move seen was just a retest to the breached ascending support turned into resistance. Hereon, we believe there will be new bearish attempts as far as the pair remains above 0.8070. Stochastic offers negative signs supporting our expectations.
The trading range expected for this week is between the key support at 0.7830 and the key resistance 0.8165.
The short-term trend is to the upside targeting 1.0370 as far as 0.7785 remains intact. 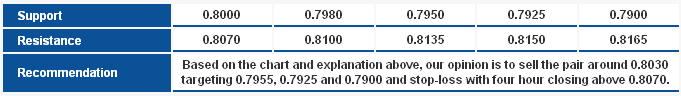 EUR/GBP_S&R" title="EUR/GBP_S&R" width="681" height="96">