
EUR/USD
 EUR/USD" title="EUR/USD" width="631" height="365">
The pair rose yesterday stabilizing above 38.2% correction failing with that our previous expectations. Stochastic offers overbought signals, but at the same time we find that the pair has formed a double bottom pattern with targets to be reached; Linear Regression Indicator 34 has also turned positive. Risk/rate ratio doesn’t suite us now especially with overbought signals on Stochastic, which makes us remain neutral for today.
The trading range for today is among the key support at 1.3000 and key resistance at 1.3225.
The general trend over the short-term is negative targeting 1.1865 as far as areas of 1.3550 remains intact.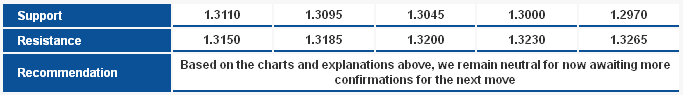 EUR/USD_S&R" title="EUR/USD_S&R" width="683" height="95">
GBP/USD GBP/USD" title="GBP/USD" width="631" height="365">
In the previous U.S. Session report, we pointed out that the upside move features started to show which may delay the suggested downside move in our weekly report. The pair is around 1.6125 levels that will be considered a significant intraday level, but the positive crossover on Stochastic in addition to stability above 1.6065 levels are reasons for us to think that the upside move might extend today.
The trading range for today is among key support at 1.6000 and key resistance at 1.6310.
The general trend over the short-term is to the downside targeting 1.6875 as far as areas of 1.4225 remains intact. 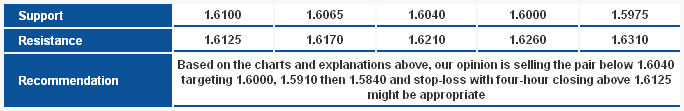 GBP/USD_S&R" title="GBP/USD_S&R" width="684" height="111">
USD/JPY USD/JPY" title="USD/JPY" width="631" height="365">
The pair dropped affected by its stability below 88.25 levels shown on the graph. The pair broke the main upside support level which might cause some bearish correction before going back to the upside again. Over intraday basis, stability below 88.25 levels is a reason for the downside move to extend, especially that Linear Regression Indicators are showing a negative bias.
The trading range for today is among key support at 86.00 and key resistance at 89.60.
The general trend over the short-term is to the upside targeting 91.70 as far as areas of 83.40 remain intact. 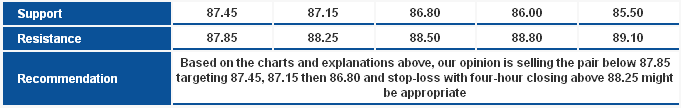 USD/JPY_S&R" title="USD/JPY_S&R" width="681" height="108">
USD/CHF USD/CHF" title="USD/CHF" width="631" height="365">
The pair dropped and is still limited above 38.2% correction levels of CD Leg of the upside harmonic AB=CD Pattern, which keeps the effect of the pattern valid. Despite that, Stochastic is showing a negative bias. Therefore, we remain neutral for today to observe the pair’s movement around 0.9300 levels to determine a clearer move.
The trading range for today is among key support at 0.9100 and key resistance at 0.9320.
The general trend over the short-term basis is to the downside stable at levels 0.9775 targeting 0.8860. 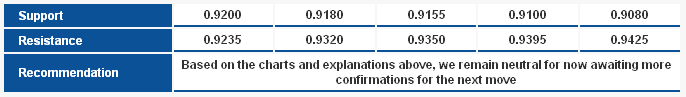 USD/CHF_S&R" title="USD/CHF_S&R" width="686" height="97">
USD/CAD USD/CAD" title="USD/CAD" width="631" height="365">
Despite the great volatility, the pair is still stable above 0.9850 levels represented in 78.6% correction shown on the graph. Therefore, the possibility of the upside move is still valid and momentum indicators shows positive bias today. Linear Regression Indicator 34 is showing bullish signals.
The trading range for today is between the key support at 0.9780 and the key resistance at 0.9965.
The general trend over the short-term is to the downside below levels 1.0125 targeting 0.9400. 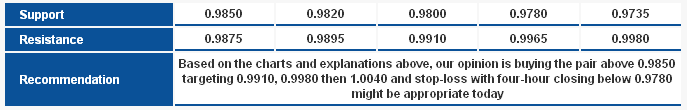 USD/CAD_S&R" title="USD/CAD_S&R" width="687" height="110">
AUD/USD AUD/USD" title="AUD/USD" width="631" height="365">
The pair is stabilizing above Linear Regression Indicators but we see that the pair's upside momentum on Stochastic is starting to weaken. Stability above 1.0344 levels forces us to keep our general positive expectations. For today, 1.0430 levels are considered our risk limit and stability above it is seen positive.
The trading range for today is among key support at 1.0340 and key resistance at 1.0565.
The general trend over the short-term is to the downside below levels 1.0710 targeting 0.9400.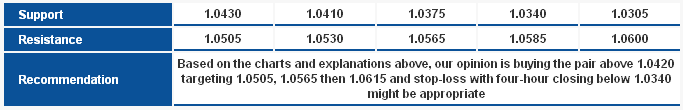 AUD/USD_S&R" title="AUD/USD_S&R" width="683" height="110">
NZD/USD NZD/USD" title="NZD/USD" width="631" height="365">
The pair is trading above Linear Regression Indicator 34 and 55 and offers positive signs. Stability above 0.8355 levels makes us think that the upside move might extend today; over intraday basis breaking 0.8280 levels is what worries us the most.
The trading range for today might be among key support at 0.8225 and key resistance at 0.8535.
The general trend over the short-term is to the upside with steady daily closing above 0.8130 targeting 0.8845. 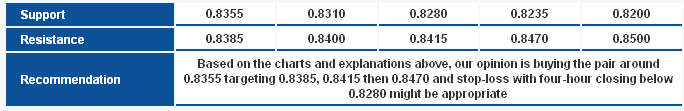 NZD/USD_S&R" title="NZD/USD_S&R" width="684" height="111">
Technical Crosses
GBP/JPY GBP/JPY" title="GBP/JPY" width="631" height="365">
Although the pair moves bearishly, it remains stable above the psychological barrier 140.00. Nonetheless, the pair began today's session below Linear Regression Indicators 34 and 55 with negative signs on momentum indicators. These factors combined prevent us from proposing a specific intraday direction. Therefore, we prefer standing aside in the European Session report to monitor the pair's behavior around 140.00.
The trading range expected for today is between the key support at 137.50 and the key resistance at 143.80.
The short-term trend is to the downside targeting 112.00 as far as 150.00 remains intact. 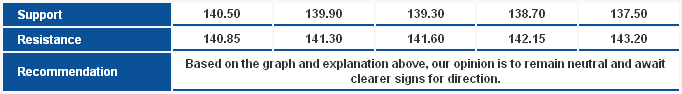 GBP/JPY_S&R" title="GBP/JPY_S&R" width="682" height="94">
EUR/JPY EUR/JPY" title="EUR/JPY" width="631" height="365">
The pair's stability below Linear Regression Indicators weakens positivity but it doesn't repel it; Stability above 113.70 maintains intraday uptrend, and stability above 111.55 maintains overall bullishness. Still, since the pair is stable below LRIs and momentum indicators are negatively biased, we believe performing neutrality is optimal for today.
The trading range for today is between the key support at 112.15 and the key resistance at 116.55.
The short-term trend is to the upside targeting 122.15 as far as 107.70 remains intact at week's closing. 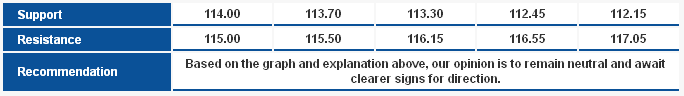 EUR/JPY_S&R" title="EUR/JPY_S&R" width="684" height="96">
EUR/GBP EUR/GBP" title="EUR/GBP" width="631" height="365">
The pair continues rising after it touched the Exponential Moving Average (EMA) 50 yesterday. Current uptrend brings the pair closer to resistance at 0.8165 once again. Breaching the upper line could cause extended upside movement supported by the ascending channel seen on the graph. Our expectations stand as far as 0.8070 remains intact.
The trading range expected for today is between the key support at 0.8010 and the key resistance 0.8260.
The short-term trend is to the upside targeting 1.0370 as far as 0.7785 remains intact. 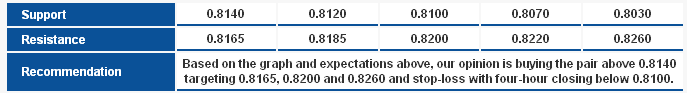 EUR/GBP_S&R" title="EUR/GBP_S&R" width="687" height="93">