
EUR/USD
 EUR/USD" title="EUR/USD" width="649" height="364">
 The pair rose as we expected in our previous report, where stability at 1.2895 and 1.2905 levels pushed it to the upside. The risk-to-reward ratio is unsuitable to bet on the possible extension of the upside move, we also referred to these levels in our weekly report as the expected reversal areas. We remain neutral for today waiting for confirmations over intraday basis.
The trading range for today is among the key support at 1.2840 and key resistance at 1.3015 .
The general trend over the short-term is to the downside targeting 1.1865 as far as areas of 1.3550 remains intact. 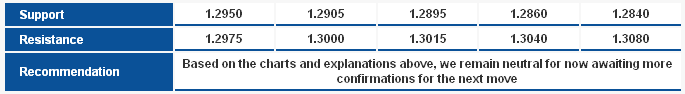 EUR/USD_S&R" title="EUR/USD_S&R" width="685" height="94">
GBP/USD GBP/USD" title="GBP/USD" width="649" height="364">
The pair rose failing our expectations with four-hour closing above 1.6065-1.6070, but we don’t want to confirm the extension of the upside move over intraday basis before breaching resistance levels at 1.6125 shown on graph. Therefore, we remain neutral until we confirm stability above 1.6070 by breaching the mentioned resistance or confirmed failure to trade above it.
The trading range for today is among key support at 1.5910 and key resistance at 1.6200 .
The general trend over the short-term is to the downside targeting 1.6875 as far as areas of 1.4225 remains intact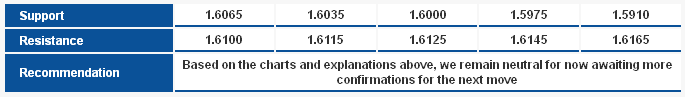 GBP/USD_S&R" title="GBP/USD_S&R" width="685" height="97">
USD/JPY USD/JPY" title="USD/JPY" width="649" height="364">
The technical negative conditions remains valid as momentum indicators are biased to the downside, and stability below 82.65 keeps the possibility of forming BC Leg of the suggested harmonic formation. Therefore, there is a possibility of a downside move during today’s session unless we see a breach and stability above 82.65 over intraday basis.
The trading range for today is among key support at 81.45 and key resistance at 83.35.
The general trend over the short-term is to the upside stable at levels 75.20 targeting 87.45. 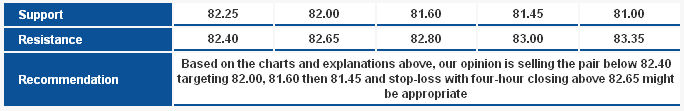 USD/JPY_S&R" title="USD/JPY_S&R" width="684" height="111">
USD/CHF USD/CHF" title="USD/CHF" width="649" height="364">
We can see signs of an Impulsive Wave (IM) formation completed at the bottom around 0.9240 levels and after that the pair started to move to the upside that may take the form of a correctional (A-B-C) wave. We might see an upside rebound unless the pair breaches the bottom at 0.9240 levels, stability above 0.9305 levels supports this possibility.
The trading range for today is among key support at 0.9200 and key resistance at 0.9455.
The general trend over the short-term is to the downside at levels 0.9775 targeting 0.8860. 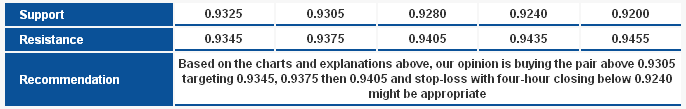 USD/CHF_S&R" title="USD/CHF_S&R" width="686" height="109">
USD/CAD USD/CAD" title="USD/CAD" width="649" height="364">
The pair touched the second target of the bearish Butterfly Pattern which is the barrier for extending the downside move or halting the pattern. Despite the negativity on the Linear Regression Indicators Stochastic offers signs of upside rebound; therefore, we prefer to stay aside for now waiting for clear signals for the coming move.
The trading range for today is among key support at 0.9800 and key resistance at 0.9935.
The general trend over the short-term is to the downside at levels 1.0125 targeting 0.9400. 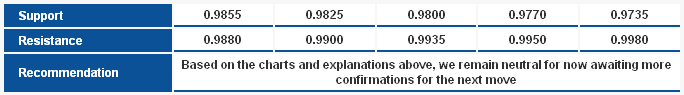 USD/CAD_S&R" title="USD/CAD_S&R" width="684" height="95">
AUD/USD AUD/USD" title="AUD/USD" width="649" height="364">
The thin weak trading prevails within the sideways range; trading is confined within the minor ascending channel shown on the graph, which is expected to organize the pair’s movement while forming the double harmonic pattern. Trading above 1.0390 keeps the possibility of an upside valid, while for today stability above 1.0450 levels supports this possibility.
The trading range for today is among key support at 1.0370 and key resistance at 1.0565.
The general trend over the shor-term is to the downside below levels 1.0710 targeting 0.9400. 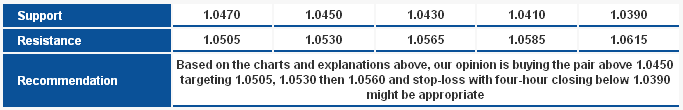 AUD/USD_S&R" title="AUD/USD_S&R" width="683" height="110">
NZD/USD NZD/USD" title="NZD/USD" width="649" height="364">
The pair is still trading positively benefiting from breaching the resistance level of the minor bearish move we previously referred to. Despite the pair entering overbought areas as shown on momentum indicators, stability above 0.8355 might extend the upside move during today’s session. Stability above 0.8285 levels is still a condition of intraday positivity.
The trading range for today is among key support at 0.8205 and key resistance at 0.8470 .
The general trend over the short-term is to the upside above 0.7930 targeting 0.8400. 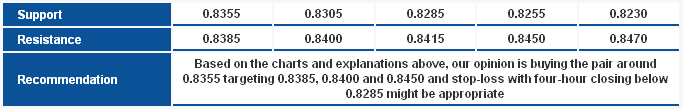 NZD/USD_S&R" title="NZD/USD_S&R" width="683" height="109">