
EUR/USD
 EUR/USD" title="EUR/USD" width="649" height="364">
The pair traded this week with downside tendency but stable now around 50% correction levels at 1.2895 and above Linear Regression Indicators 55 which may trigger an upside correction. Stochastic shows oversold signals supporting the correction mentioned earlier; nevertheless, trading below 1.3015 will support the extension of the downside move in the coming period.
The trading range for this week is among key support at 1.2715 and key resistance at 1.3165 .
The general trend over the short-term is negative targeting 1.1865 as far as areas of 1.3550 remain intact. 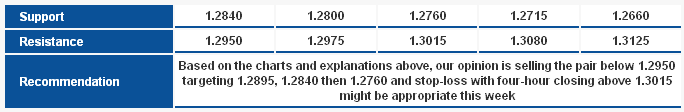 EUR/USD_S&R" title="EUR/USD_S&R" width="684" height="112">
GBP/USD GBP/USD" title="GBP/USD" width="649" height="364">
The pair returned to trade below key resistance level of the bearish correctional move shown on the chart which might cause a new downside wave. The suggested wave might retest levels close to 1.5910; breaching correction 38.2% and stability below it is required to extend the bearish move. Failure to breach the mentioned areas might cause a strong upside move. Our expectations are negative this week, but if the pair fails to breach 1.5910 we will turn positive.
The trading range for this week is among key support at 1.5790 and key resistance at 1.6310.
The general trend over the short-term is to the downside targeting 1.6875 as far as areas of 1.4225 remain intact. 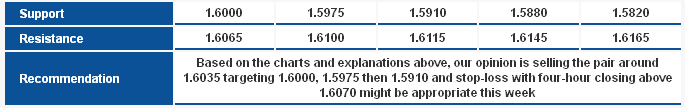 GBP/USD_S&R" title="GBP/USD_S&R" width="685" height="108">
USD/JPY USD/JPY" title="USD/JPY" width="649" height="364">
The pair’s trading remained limited below 82.65 levels with four-hour closing as shown on the chart. The possibility of a bearish move remains valid with stability below 83.35 as the pair might be forming a harmonic formation. RSI is trading negatively and Stochastic provided a negative crossover close to 70 levels supporting the negative outlook.
The trading range for this week is among key support at 79.80 and key resistance at 84.15 .
The general trend over the short-term is to the downside stable at levels 0.9775 targeting 0.8860. 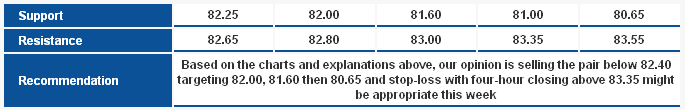 USD/JPY_S&R" title="USD/JPY_S&R" width="685" height="110">
USD/CHF USD/CHF" title="USD/CHF" width="649" height="364">
The pair stabilized above Linear Regression Indicators but still trading negatively; Stochastic is also showing overbought signals. Therefore, we remain neutral in our weekly report, especially that breaching the Linear Regression Indicators was seen with a bearish opening gap. Areas of 0.9305 and 0.9280 levels are the most important support levels, while 0.9435 is the closest resistance levels over weekly basis.
The trading range for this week is among key support at 0.9240 and key resistance at 0.9505.
The general trend over the short-term is to the downside at levels 0.9775 targeting 0.8860. 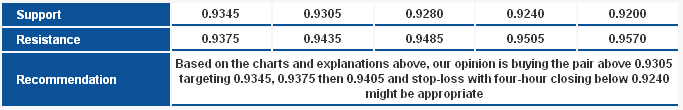 USD/CHF_S&R" title="USD/CHF_S&R" width="683" height="110">
USD/CAD USD/CAD" title="USD/CAD" width="649" height="364">
The pair dropped reaching close to the second target of the bearish Harmonic Butterfly Pattern at 0.9855 levels. Stochastic is showing oversold signals as the harmonic technical analysis shows that the second target at 0.9855 represents an interval between the possible extension of the targets or settling for the downside move. Therefore, we remain neutral in our weekly report waiting for new confirmation signals.
The trading range for this week is among key support at 0.9735 and key resistance at 1.0040.
The general trend over the short-term is to the downside at levels 1.0125 targeting 0.9400. 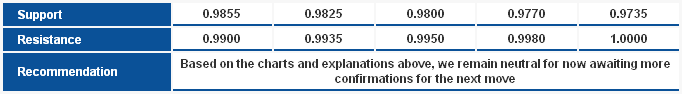 USD/CAD_S&R" title="USD/CAD_S&R" width="682" height="94">
AUD/USD AUD/USD" title="AUD/USD" width="649" height="364">
The pair is trading between Linear Regression Indicators 34 and 55 as shown on the chart. Stochastic is showing negative signals alongside the negative bias on the Linear Regression Indicator 34. Nevertheless, the possibility of forming a double harmonic formation remains valid by undergoing an upside move reaching around 1.0565 levels. The bullishness and the activation of the technical harmonic pattern depends on stability above 1.0390.
The trading range for this week is among key support at 1.0260 and key resistance at 1.0645.
The general trend over the short-term is to the downside below levels 1.0710 targeting 0.9400. 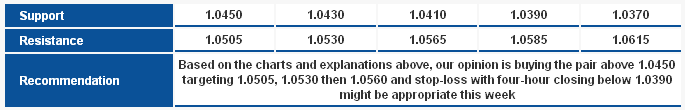 AUD/USD_S&R" title="AUD/USD_S&R" width="685" height="110">
NZD/USD NZD/USD" title="NZD/USD" width="649" height="364">
The positive technical conditions prevail with stability above key resistance levels of the downside correction, we might see new attempts to breach 0.8355 which might trigger another upside move. Stochastic offers overbought signals which might cause significant fluctuation, yet trading above 0.8285 is considered positive.
The trading range for this week is among key support at 0.8135 and key resistance at 0.8535 .
The general trend over the short-term is to the upside above 0.7930 targeting 0.8400. 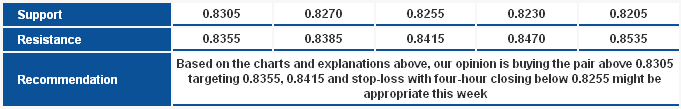 NZD/USD_S&R" title="NZD/USD_S&R" width="681" height="109">
Technical Crosses
GBP/JPY GBP/JPY" title="GBP/JPY" width="649" height="364">
The pair failed to stabilize below 131.85 to confirm the bearishness; however, negative technical circumstances hold via trading below the channel's main resistance. In addition, the negative divergence on momentum indicators influential as top that was confirmed by the PRZ around 132.90 remains intact. Therefore, we still expect further bearish attempts this week, realized by stability below 131.85.
The trading range expected for this week is between the key support at 129.05 and the key resistance at 135.40 .
The short-term trend is to the downside targeting 112.00 as far as 150.00 remains intact. 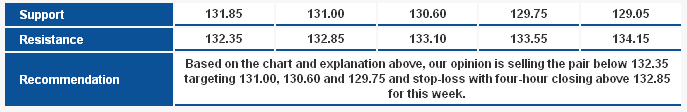 GBP/JPY_S&R" title="GBP/JPY_S&R" width="687" height="112">
EUR/JPY EUR/JPY" title="EUR/JPY" width="649" height="364">
The pair touches levels near 1 06.25; this level is our decisive mark toward confirming continued negativity . Stochastic entered oversold areas, yet the general setup shows possibility of entering a downside correction is very likely. Nonetheless, for such expectation to be confirmed, stability below 106.25 is vital, and when confirmed, the proposed harmonic pattern will become more credible.
The trading range expected this week is between the key support at 104.15 and the key resistance 109.15.
The short-term trend is to the upside targeting 109.15 as far as 98.75 remains intact at week's closing. 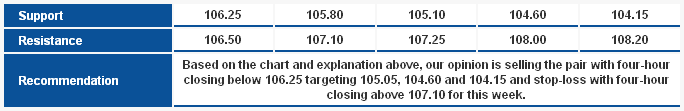 EUR/JPY_S&R" title="EUR/JPY_S&R" width="684" height="111">
EUR/GBP EUR/GBP" title="EUR/GBP" width="649" height="364">
There is a chance that an ascending channel might be formed, however, currently we cannot confirm such expectation due to trading below Linear Regression Indicators and below Exponential Moving Average (EMA) 50. Meanwhile, the downside move provided a breach of 0.8070 which prevents us from expecting positivity any time soon. Therefore, we prefer staying aside until an ascending channel is created or thwarted - through breaching 0.8000 or 0.8070.
The trading range expected for this week is between the key support at 0.9760 and the key resistance 0.8165.
The short-term trend is to the upside targeting 1.0370 as far as 0.7785 remains intact. 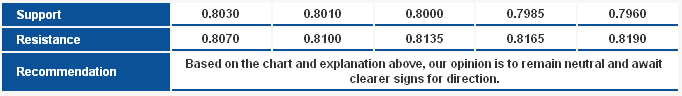 EUR/GBP_S&R" title="EUR/GBP_S&R" width="682" height="96">