
EUR/USD
 EUR/USD" title="EUR/USD" width="640" height="385">
The pair dropped as expected and is trading below the Linear Regression Indicator 34 were we expect an extension of the downside move and might test Fibonacci levels shown on the chart. Stability below 1.3095 levels keeps the downside move valid, but over intraday basis we prefer holding below 1.3030 to keep the negative outlook intact.
The trading range for today is among key support at 1.2760 and key resistance at 1.3170 .
The general trend over the short-term is negative targeting 1.1865 as far as areas of 1.3550 remain intact. 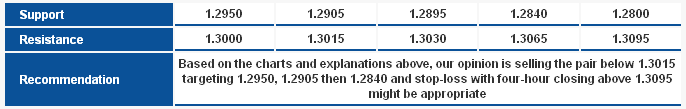 EUR/USD_S&R" title="EUR/USD_S&R" width="686" height="109">
GBP/USD GBP/USD" title="GBP/USD" width="640" height="385">
The pair dropped yesterday failing our expectations and returned below 1.6065, the drop brought the pair back to trade below the key resistance level of the bearish correctional move shown on the chart. Stochastic shows oversold signals; in addition we need more confirmation regarding the pair’s direction, therefore we remain neutral in the European session today.
The trading range for today is among the key support at 1.5910 and key resistance at 1.6265.
The general trend over the short-term is to the downside targeting 1.6875 as far as areas of 1.4225 remain intact. 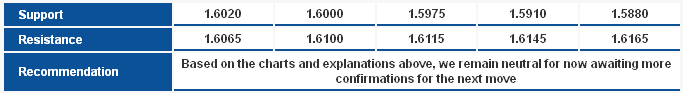 GBP/USD_S&R" title="GBP/USD_S&R" width="683" height="93">
USD/JPY USD/JPY" title="USD/JPY" width="640" height="385">
The pair traded yesterday with high volatility and a downside bias. Today we find the pair stabilizing below 82.65 keeping the bearish correctional trend. The suggested downside move move is triggered by the caught harmonic formation of which the pair completed the BC leg above.
The trading range for today is among key support at 81.45 and key resistance at 83.35.
The general trend over the short-term is to the upside at levels 75.20 targeting 87.45. 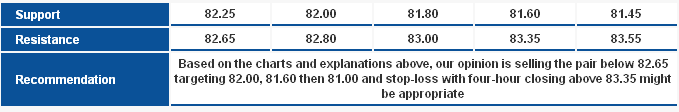 USD/JPY_S&R" title="USD/JPY_S&R" width="679" height="112">
USD/CHF USD/CHF" title="USD/CHF" width="640" height="385">
The Harmonic Butterfly Pattern we adopted earlier has significantly weakened and the pair stabilized above 0.9305 levels that represent 23.6% correction of the downside wave shown on the chart. It is possible to witness more upside movement supported by positive Linear Regression Indicators. We might see great volatility due to overbought signals shown on the Stochastic.
The trading range for today is among key support at 0.9200 and key resistance at 0.9455.
The general trend over the short-term is to the downside at levels 0.9775 targeting 0.8860.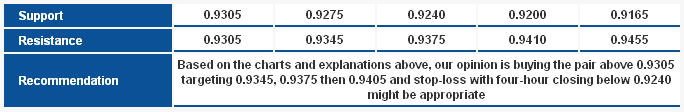 USD/CHF_S&R" title="USD/CHF_S&R" width="684" height="112">
USD/CAD USD/CAD" title="USD/CAD" width="640" height="385">
The pair touched the 50% correction of the CD Leg of the bearish Harmonic Butterfly Pattern yesterday. Stability below 0.9935 levels represented in the first target of the pattern might extend the bearishness toward the second target at 0.9855 levels.
The trading range for today is among key support at 0.9800 and key resistance at 1.0040.
The general trend over the short-term is to the downside at levels 1.0125 targeting 0.9400. 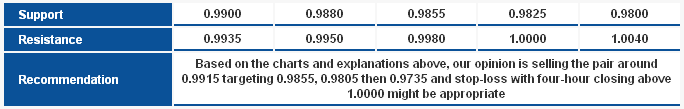 USD/CAD_S&R" title="USD/CAD_S&R" width="684" height="109">
AUD/USD AUD/USD" title="AUD/USD" width="640" height="385">
The pair touched the first suggested target yesterday before turning lower once again. The downside move remained limited above 1.0390 areas and that supports the return to the upside once again attempting at 1.0565 areas. The double harmonic formation supports our bullish expectations.
The trading range for today is among key support at 1.0370 and key resistance at 1.0565.
The general trend over the short-term is to the downside below levels 1.0710 targeting 0.9400. 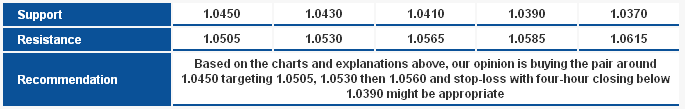 AUD/USD_S&R" title="AUD/USD_S&R" width="685" height="109">
NZD/USD NZD/USD" title="NZD/USD" width="640" height="385">
The pair was supported from the breach of the main resistance of the minor downside wave to move higher close to 0.8355 resistance. The Linear Regression Indicators remains positive, allowing us to keep our bullish expectations.
The trading range for today is among key support at 0.8205 and key resistance at 0.8470.
The general trend over the short-term is to the upside above 0.7930 targeting 0.8400. 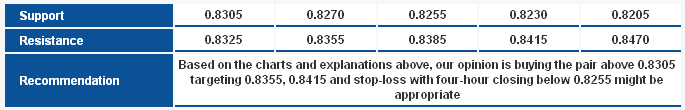 NZD/USD_S&R" title="NZD/USD_S&R" width="685" height="110">
Technical Crosses
GBP/JPY GBP/JPY" title="GBP/JPY" width="640" height="385">
The designated area on the chart between November 23, 2012 and December 05, 2012, we can see the bearish divergence on momentum indicators; this exhausts the upside trend and carries possibility of a downside correction . Stability below 133.55 is a condition to intraday negativity, however, we prefer to see stability below 133.10 to support the bearish outlook.
The trading range expected for today is between the key support at 130.60 and the key resistance at 133.55 .
The short-term trend is to the downside targeting 112.00 as far as 150.00 remains intact. 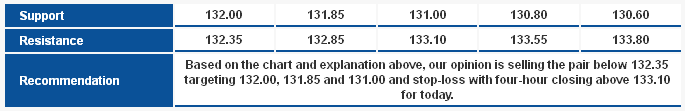 GBP/JPY_S&R" title="GBP/JPY_S&R" width="685" height="111">
EUR/JPY EUR/JPY" title="EUR/JPY" width="640" height="385">
The pair dropped below 107.00 level and stabilized below Linear Regression Indicator 34. Stochastic offers negative signals, so does Relativity Strength Index (RSI). Therefore, we expect further bearishness today and breaching 106.25 will confirm our expectations.
The trading range expected today is between the key support at 105.15 and the key resistance 108.85.
The short-term trend is to the upside targeting 109.15 as far as 98.75 remains intact at week`s closing. 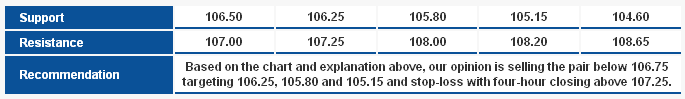 EUR/JPY_S&R" title="EUR/JPY_S&R" width="685" height="99">
EUR/GBP
Although the pair failed to close over four-hour bias below 0.8070, there remains negative features those of Linear Regression Indicators and trading below Exponential Moving Average (EMA) 50. Nonetheless, we cannot confirm the negativity anytime soon due to oversold signals Stochastic shows, and unconfirmed breach of 0.8070, therefore we remain netural for today.
The trading range expected for today is between the key support at 0.8000 and the key resistance 0.8165.
The short-term trend is to the upside targeting 1.0370 as far as 0.7785 remains intact. 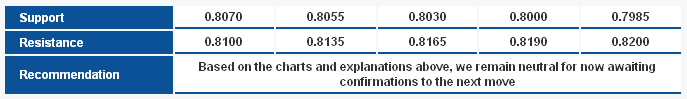 EUR/GBP_S&R" title="EUR/GBP_S&R" width="687" height="99">