
EUR/USD
 EUR/USD" title="EUR/USD" width="470" height="809">
The pair dropped to trade negatively below the key resistance level of the sideways correctional wave; momentum indicators are also negative indicating the possible extension of the downside correction. The awaited downside correction relies on stability below 1.3170 levels, but we prefer intraday stability below 1.3125.
The trading range for today is among key support at 1.2905 and key resistance at 1.3235 .
The general trend over the short-term is negative targeting 1.1865 as far as areas of 1.3550 remain intact. 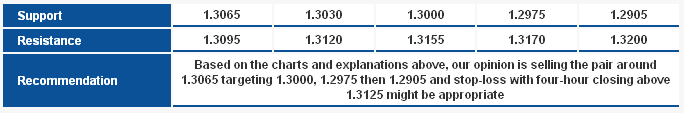 EUR/USD_S&R" title="EUR/USD_S&R" width="684" height="113">
GBP/USD GBP/USD" title="GBP/USD" width="470" height="809">
The pair’s trading remained limited above 1.6065 levels keeping the possibility for more upside attempts, especially that Stochastic entered overbought areas. Breaching key resistance levels of the bearish correctional wave shown on the chart causes the suggested positivity that depends on intraday stability above 1.5960 over intraday basis.
The trading range for today is among the key support at 1.5910 and key resistance at 1.6265.
The general trend over the short-term is to the downside targeting 1.6875 as far as areas of 1.4225 remain intact. 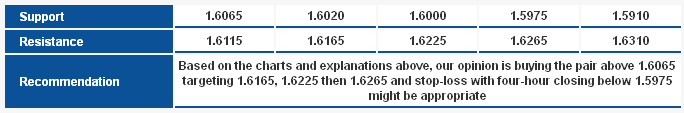 GBP/USD_S&R" title="GBP/USD_S&R" width="684" height="113">
USD/JPY USD/JPY" title="USD/JPY" width="470" height="809">
The pair rose yesterday and failed to maintain its bearish trend. Although the general bearish trend is valid below 83.35 levels, Stochastic shows that the pair gained upside momentum which might support the pair to the upside; nevertheless, unless the pair breaches the 83.35 level the downside move remains likely.
The trading range for today is among key support at 81.45 and key resistance at 83.35.
The general trend over the short-term is to the upside at levels 75.20 targeting 87.45. 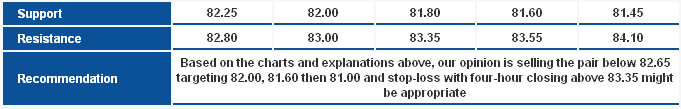 USD/JPY_S&R" title="USD/JPY_S&R" width="681" height="109">
USD/CHF USD/CHF" title="USD/CHF" width="470" height="809">
Severe volatility in trading was seen and caused us to cancel our previous expectations due to risks that the bearish Butterfly Harmonic Pattern's effect has ended. Today the pair is stable below the bottom C of the harmonic pattern indicating the extension of the negative effect of the pattern. At the same time, the pair is stable above the Linear Regression Indicators which opposes to the negative effect of the Butterfly pattern; therefore, we remain neutral till we confirm the exit of the trading range between 0.9275 and 0.9245 levels.
The trading range for today is among key support at 0.9130 and key resistance at 0.9395.
The general trend over the short-term is to the downside at levels 0.9775 targeting 0.8860. 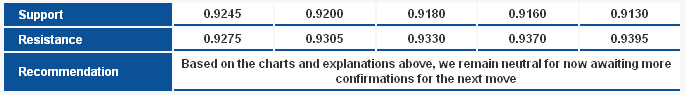 USD/CHF_S&R" title="USD/CHF_S&R" width="685" height="95">
USD/CAD USD/CAD" title="USD/CAD" width="470" height="809">
Despite the pair’s failure to move to the upside, we see it stable above the Linear Regression Indicators which may form a double harmonic formation. Stochastic breached 50 areas to the upside which gives the positive scenario more credibility. It is important to point out that breaching 1.0390 levels failed our expectations.
The trading range for today is among key support at 1.0370 and key resistance at 1.0565.
The general trend over the short-term is to the downside below levels 1.0710 targeting 0.9400. 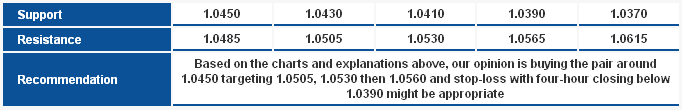 AUD/USD_S&R" title="AUD/USD_S&R" width="682" height="110">
NZD/USD NZD/USD" title="NZD/USD" width="470" height="809">
The pair failed to breach 0.8230 levels therefore it didn’t activate the negative scenario suggested earlier, on the contrary, it breached the key resistance of the bearish correctional channel shown on the chart. Therefore, the pair might attempt to the upside and stability above 0.8230 will push the pair to test 0.8310 and 0.8355 levels at least.
The trading range for today is among key support at 0.8185 and key resistance at 0.8415 .
The general trend over the short-term is to the upside above 0.7930 targeting 0.8400. 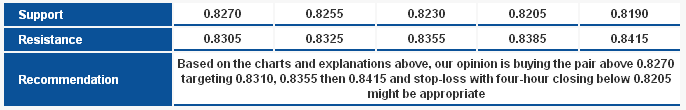 NZD/USD_S&R" title="NZD/USD_S&R" width="686" height="110">
Technical Crosses
GBP/JPY GBP/JPY" title="GBP/JPY" width="470" height="809">
The pair moves upside approaching the main resistance of the ascending channel, and we have witnessed the strength of this resistance several times. We also see the pair close to 113% of CD leg of the bullish Harmonic Bat Pattern at 133.55 which is another major obstacle. The risk to reward ratio is now appropriate to bet on the possible bearishness today, and Stochastic supports our expectation.
The trading range expected for today is between the key support at 130.60 and the key resistance at 133.55 .
The short-term trend is to the downside targeting 112.00 as far as 150.00 remains intact. 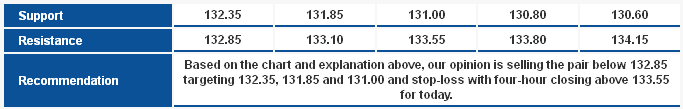 GBP/JPY_S&R" title="GBP/JPY_S&R" width="683" height="109">
EUR/JPY EUR/JPY" title="EUR/JPY" width="470" height="809">
The pair fluctuated in a narrow range yesterday, and remains close to the main resistance of the ascending channel today. The pair is in levels that will likely complete the formation of the harmonic pattern "BC" leg, nonetheless, risk/reward ratio is still inconvenient and compels us to remain neutral for now. We note that breaking 107.00 level signals the start of the bearishness.
The trading range expected today is between the key support at 105.75 and the key resistance 109.15.
The short-term trend is to the upside targeting 109.15 as far as 98.75 remains intact at week's closing. 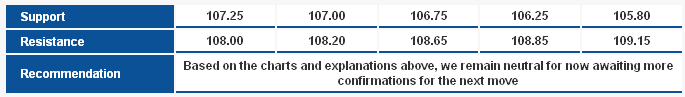 EUR/JPY_S&R" title="EUR/JPY_S&R" width="685" height="97">
EUR/GBP EUR/GBP" title="EUR/GBP" width="470" height="809">
Despite the downside move, the pair remains above the main ascending support shown on the chart, also trading is stable above the Exponential Moving Average (EMA) 50; in addition to Stochastic entering oversold areas. These signs help us expect new bullish attempts, as far as 0.8070 remains intact.
The trading range expected for today is between the key support at 0.8030 and the key resistance 0.8225.
The short-term trend is to the upside targeting 1.0370 as far as 0.7785 remains intact. 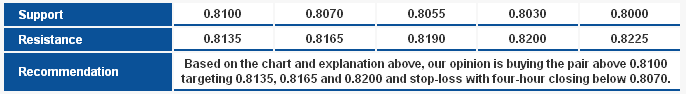 EUR/GBP_S&R" title="EUR/GBP_S&R" width="686" height="94">