Get 40% Off
🚨 Volatile Markets? Find Hidden Gems for Serious Outperformance
Find Stocks Now

USD/JPY Above 123.15 Zone; EUR/USD Moves Lower

Published 11/23/2015, 05:56 AM
Updated 07/09/2023, 06:31 AM

USD/JPY

The USD/JPY has been able to come again above 123.15 zone, which is currently under attack as seen on the provided daily chart.
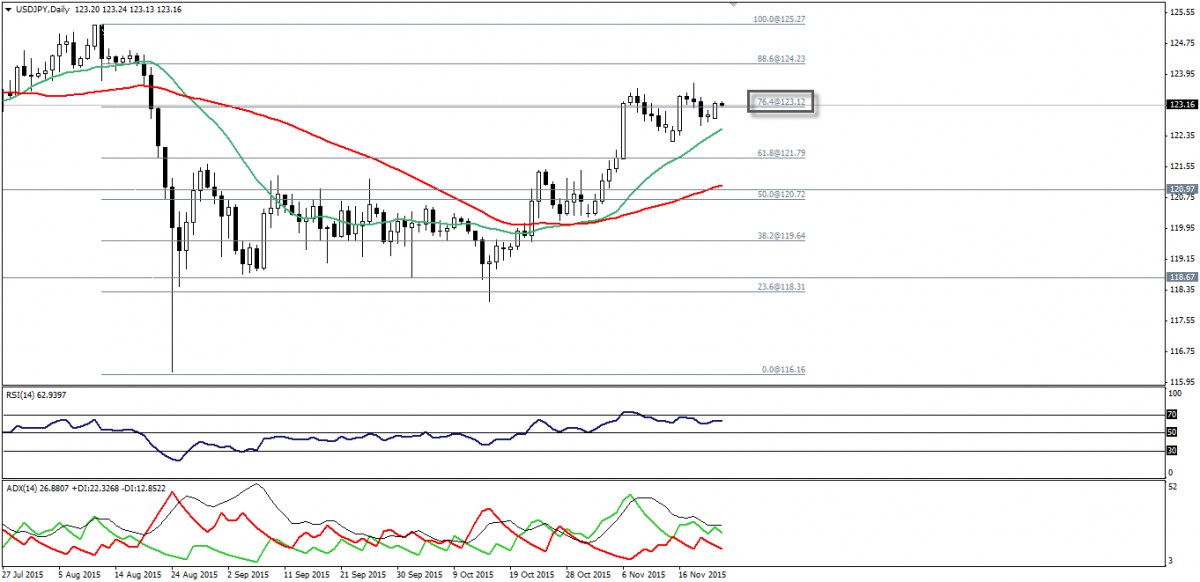
USD/JPY Daily Chart

RSI stabilizes above the value of 50.00, while ADX remains positive and that should bring further upside actions.

But we will not recommend new positions now until the pair proves stability above these levels.

On the downside, 122.60 is the key for intraday bulls, as a break of which will negate any upside scenarios.

Support: 122.80-122.60-122.10

Resistance: 123.60-124.15-124.30

Direction: Bullish, but we will avoid trading until the pair proves the ability to stabilize above 123.15.

USD/CHF

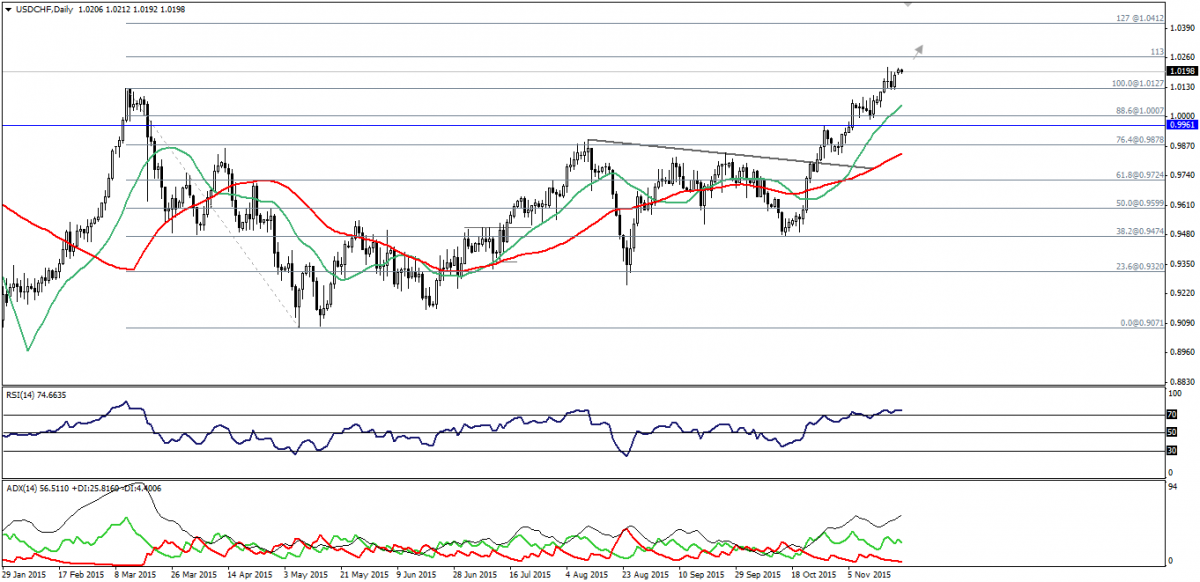
USD/CHF moved according to the bullish scenario discussed several times after stabilizing above 1.0125 where 100% Fibonacci exists.

USD/CHF Daily Chart

Actually, RSI14 shows extreme case of overbought, but that will not prevent us from being bullish, as the weekly chart remains bullish along with stability above moving averages.

Any fluctuation occurs because of RSI signal should be used by bulls and a break above 113% Fibonacci at 1.0260 will accelerate.

Support: 1.0170-1.0050-0.9990

Resistance: 1.0260-1.0290-1.0325

Direction: Bullish

EUR/USD

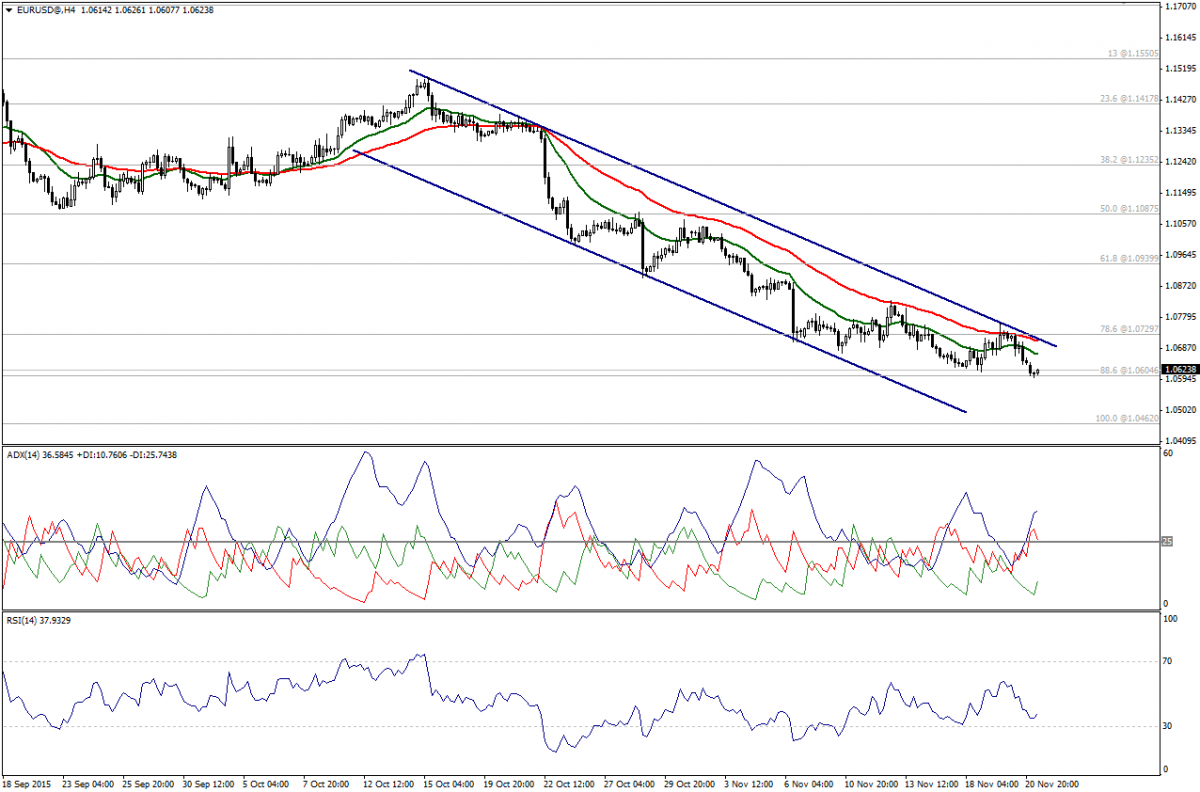
EUR/USD continued to move lower inside the bearish channel appearing on the chart and below moving averages 20 and 50.

EUR/USD 4-Hour Chart

ADX is negative, while RSI moves below 50.00 levels and that would bring further downside actions.

A stable move below 1.0615w will extend the bearishness, but on the upside, 1.0730 is the ceiling, while 1.0660 is the key for intraday bears.

Support: 1.0600 – 1.0570 – 1.0500

Resistance: 1.0660 –1.0700 – 1.0730

3rd party Ad. Not an offer or recommendation by Investing.com. See disclosure here or remove ads .

Direction: Bearish below 1.0600

GBP/USD

GBP/USD faces 61.8$ Fibonacci at 1.5145 after drawing a bearish crossover on moving averages, while ADX shows negative signals.
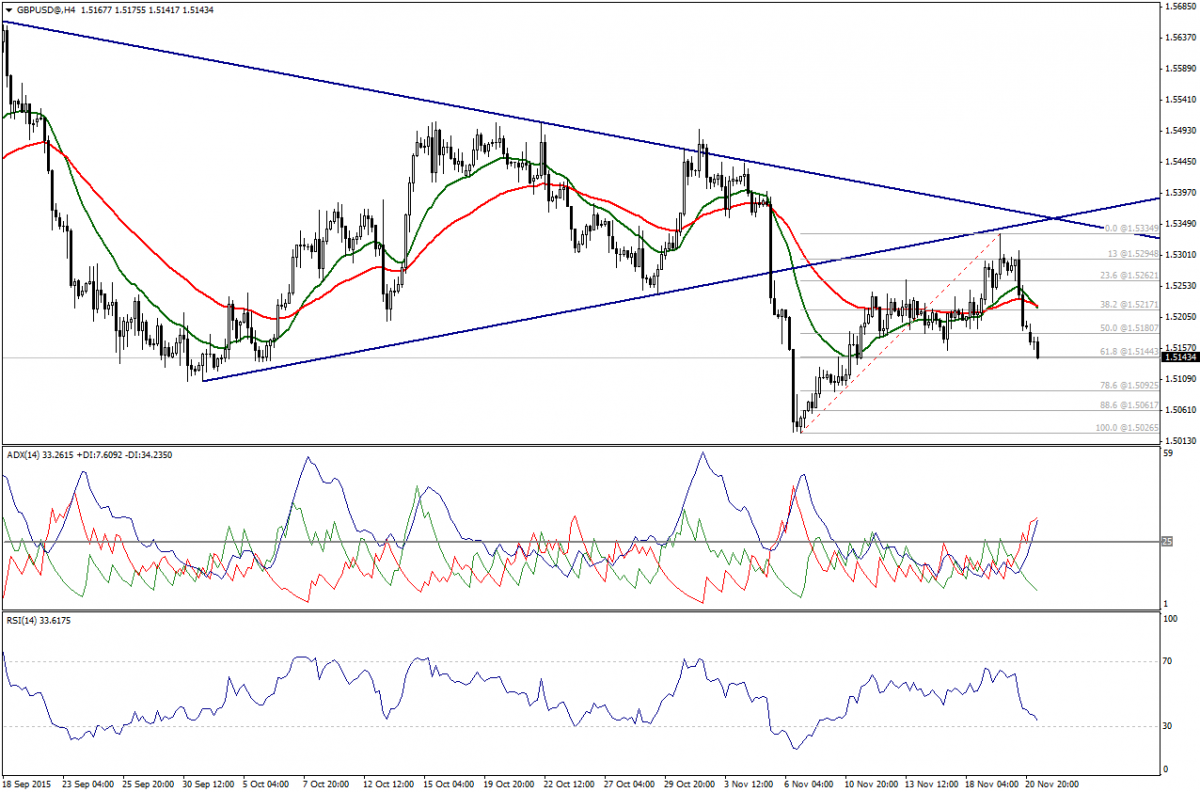
GBP/USD 4-Hour Chart

Hence, we suggest potential downside wave resumption; noting that, 1.50 becomes in focus as far as 1.5220 holds.

Support: 1.5120 – 1.5090 – 1.5060

Resistance: 1.5180 – 1.5220 – 1.5260

Direction: Bearish

Latest comments

Risk Disclosure: Trading in financial instruments and/or cryptocurrencies involves high risks including the risk of losing some, or all, of your investment amount, and may not be suitable for all investors. Prices of cryptocurrencies are extremely volatile and may be affected by external factors such as financial, regulatory or political events. Trading on margin increases the financial risks.
Before deciding to trade in financial instrument or cryptocurrencies you should be fully informed of the risks and costs associated with trading the financial markets, carefully consider your investment objectives, level of experience, and risk appetite, and seek professional advice where needed.
Fusion Media would like to remind you that the data contained in this website is not necessarily real-time nor accurate. The data and prices on the website are not necessarily provided by any market or exchange, but may be provided by market makers, and so prices may not be accurate and may differ from the actual price at any given market, meaning prices are indicative and not appropriate for trading purposes. Fusion Media and any provider of the data contained in this website will not accept liability for any loss or damage as a result of your trading, or your reliance on the information contained within this website.
It is prohibited to use, store, reproduce, display, modify, transmit or distribute the data contained in this website without the explicit prior written permission of Fusion Media and/or the data provider. All intellectual property rights are reserved by the providers and/or the exchange providing the data contained in this website.
Fusion Media may be compensated by the advertisers that appear on the website, based on your interaction with the advertisements or advertisers.
© 2007-2024 - Fusion Media Limited. All Rights Reserved.