
EUR/USD:EUR/USD" title="EUR/USD" src="https://d1-invdn-com.akamaized.net/content/pic50b5ebd065bea64884d4768b80f4b5ca.png" height="746" width="1596">
The EUR/USD maintained stability above 78.6% correction at 1.3505, stability above which supports the bullish bias, especially as Linear Regression Indicators are positive since the breach of 61.8% correction. At the same time we should not ignore the overbought signals on momentum indicators which requires stability above 1.3505 to offset the negative pressures and maintain the upside bias.
The trading range for this week is among the key support at 1.3315 and key resistance at 1.3970.
The general trend over short term basis is sideways targeting 1.2775 as far as 1.3600 is daily-closing.EUR/USD_S&R" title="EUR/USD_S&R" src="https://d1-invdn-com.akamaized.net/content/pic35c926956bbacdd4475344b491130ca9.png" height="746" width="1596">
GBP/USD: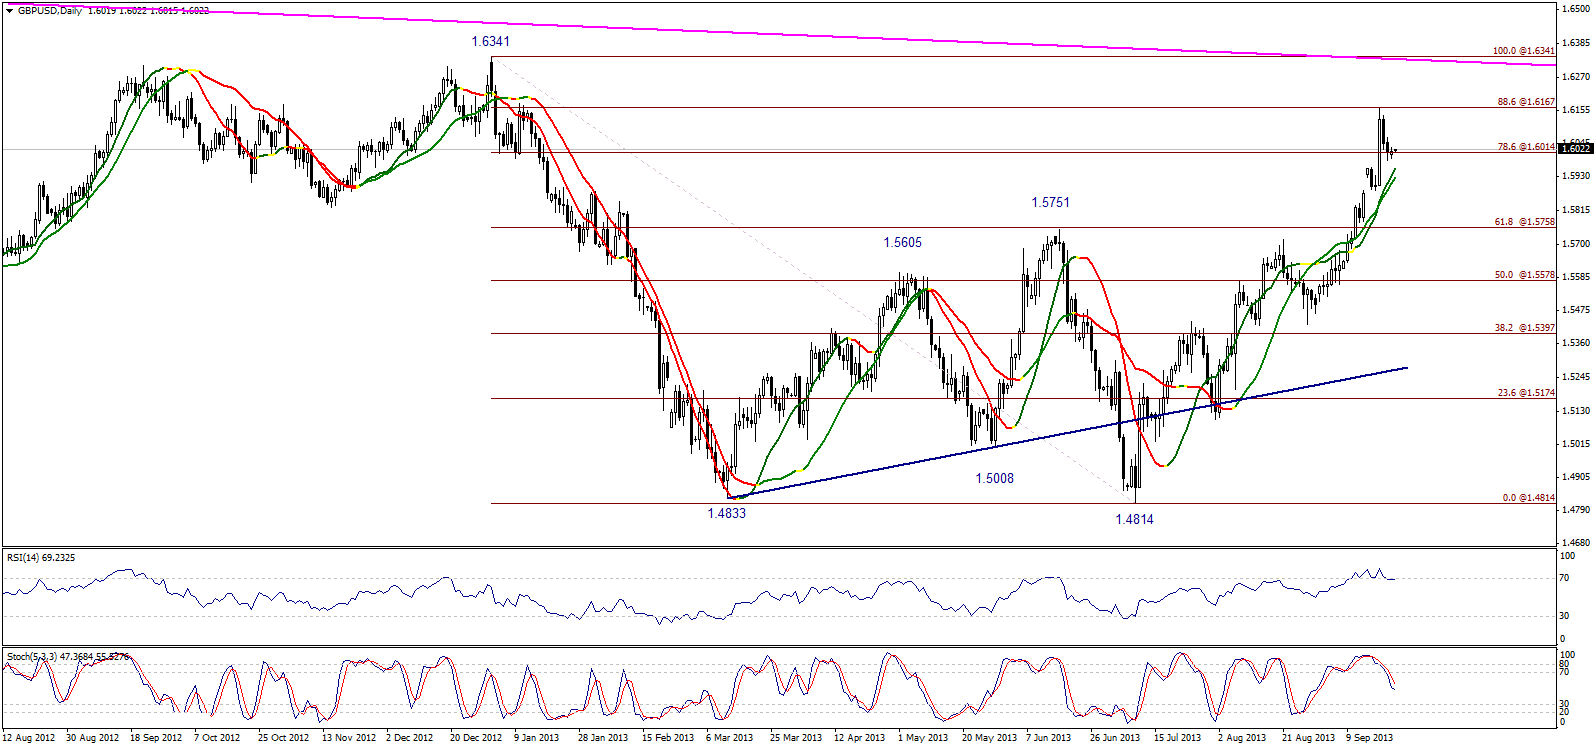 GBP/USD" border="0" height="746" width="1596">
The GBP/USD moved lower to the end of last week, yet the bearishness remained limited in areas around 1.6010 -78.6% correction- shown on graph. Although trading above 1.5750 is now positive, but for this week we require trading to hold above 1.5905 to support chances for bullishness this week. We will hold onto our expectations for further gains this week as far as the mentioned 1.5905 areas hold.
The trading range for this week is among the key support at 1.5750 and key resistance at 1.6340.
The general trend over short term basis is to the upside as far as areas of 1.5280 remains intact targeting 1.6540.GBP/USD_S&R" title="GBP/USD_S&R" src="https://d1-invdn-com.akamaized.net/content/pic6cb90d7a254318858244a15870b43504.png" height="746" width="1596">
USD/JPY: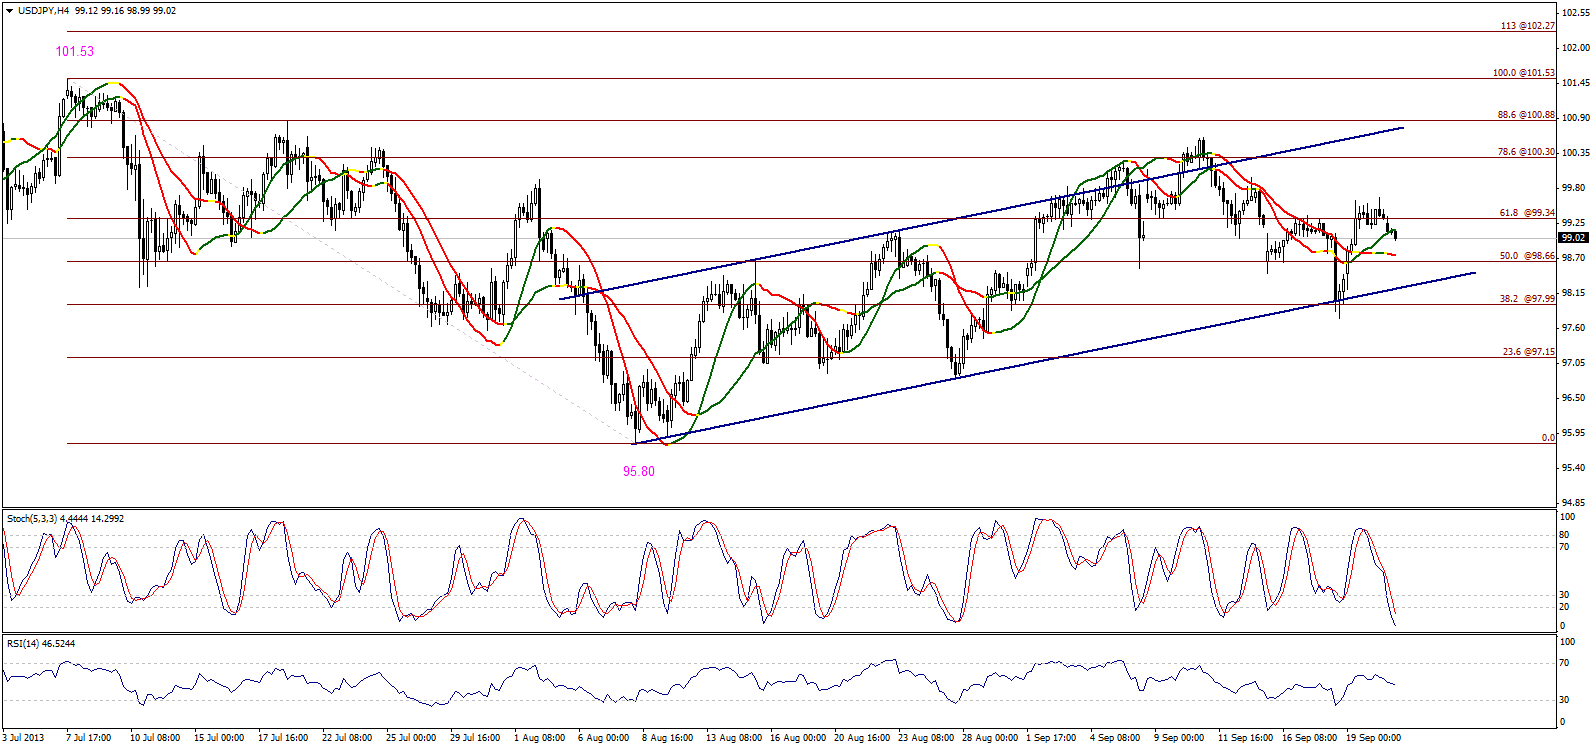 USD/JPY" border="0" height="746" width="1596">
The USD/JPY failed in holding above 99.95 last week and returned to the downside with the kick-start of trading this week below 61.8% correction at 99.35 and Linear Regression Indicator 34. This makes us expect further downside movement for the week, and bearishness remains favored as far as trading is below 99.95. A breakout above 99.95 might support the upside move to test 78.6% and 88.6% correction at 100.30 and 100.90 respectively.
The trading range for this week is among key support at 96.25 and key resistance at 101.55.
The general trend over short term basis is to the downside as far as areas of 103.50 remain intact targeting 93.50.USD/JPY_S&R" title="USD/JPY_S&R" src="https://d1-invdn-com.akamaized.net/content/pic8454e3337296471ce4ed1b3e9ddd7131.png" height="746" width="1596">
USD/CHF: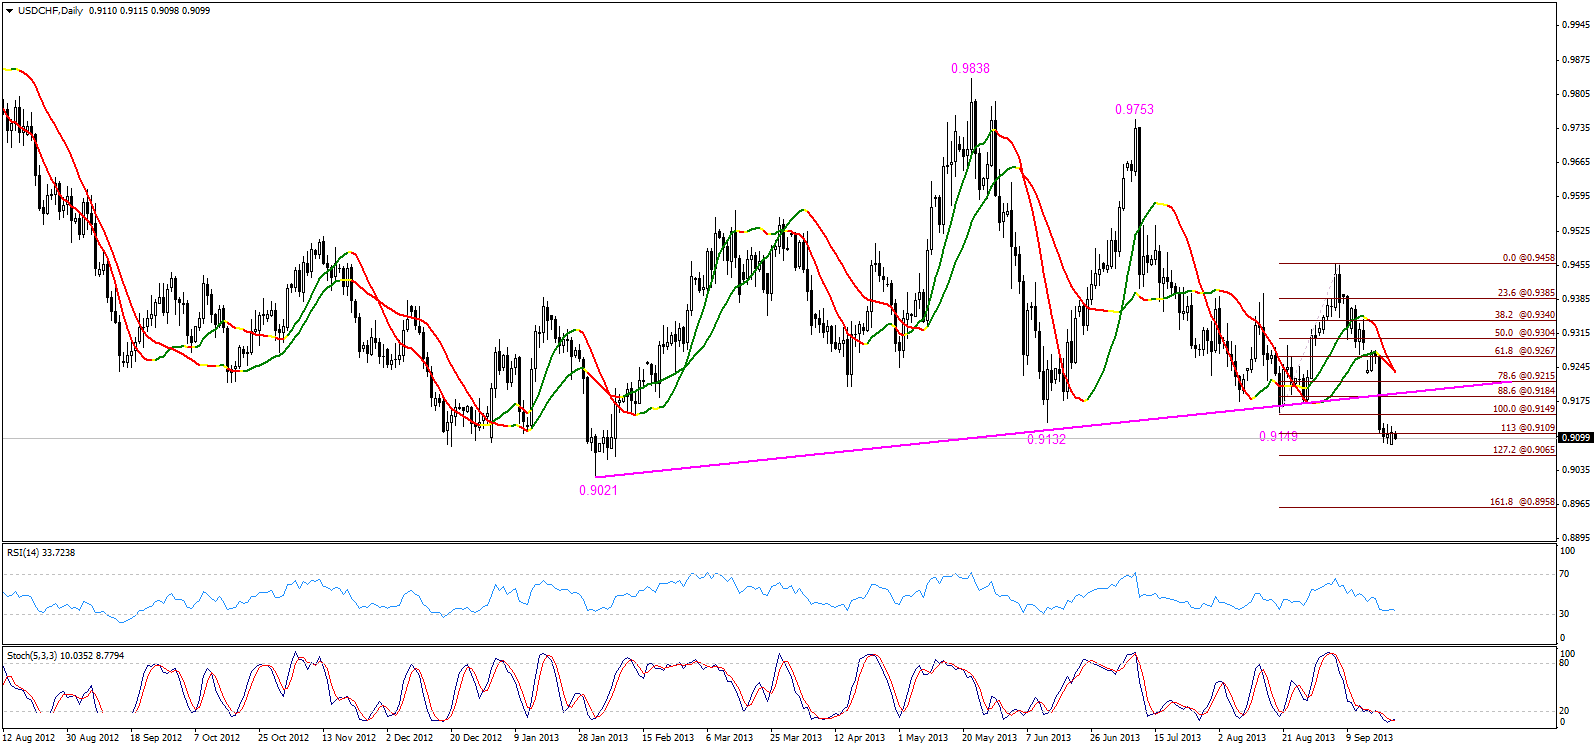 USD/CHF" border="0" height="746" width="1596">
The USD/CHF consolidated above 0.9110 in the latter half of last week which supports the bearish outlook for this week. The downside bias remains favored based on the breakout below the main ascending support and the negativity on Linear Regression Indicators. The bearish outlook requires stability below 0.9185 that is needed to offset oversold signals on momentum indicators.
The trading range for this week is among key support at 0.8840 and key resistance at 0.9295.
The general trend over short term basis is to the downside stable at levels 0.9775 targeting 0.8860.USD/CHF_S&R" title="USD/CHF_S&R" src="https://d1-invdn-com.akamaized.net/content/picb2ea1a190813fb7ef68648eec0771972.png" height="746" width="1596">
USD/CAD: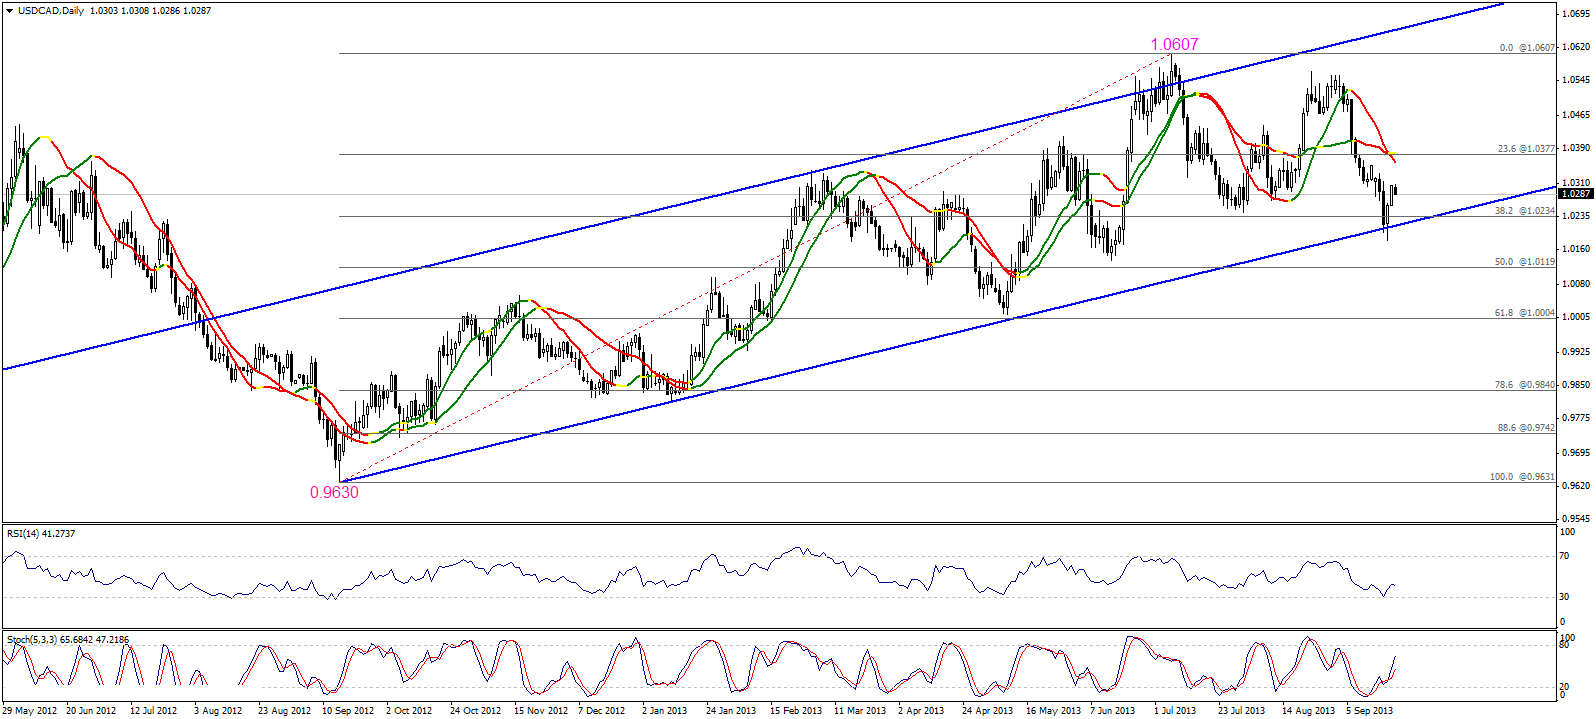 USD/CAD" border="0" height="719" width="1596">
We are almost certain that the downside correction is complete for the USD/CAD after the pair failed to hold below 1.0205 last week. Assessing the general movement for the pair over the medium-term we notice how the pair stabilized above 38.2% correction of the upside wave from 0.9630 to the set peak at 1.0607. The pair also stabilized above the main support of the ascending channel. Therefore, we consider trading above 1.0235 positive and will support the upside wave targeting 23.6% correction at 1.0380 a breach of which will trigger another upside wave this week.
The trading range for this week is between the key support at 1.0120 and the key resistance at 1.0455.
The general trend over short term basis is to the upside with steady daily closing above levels 1.0100 targeting 1.0775.USD/CAD_S&R" title="USD/CAD_S&R" src="https://d1-invdn-com.akamaized.net/content/piceec0db83de5b198092f5bc2e94044235.png" height="746" width="1596">
AUD/USD: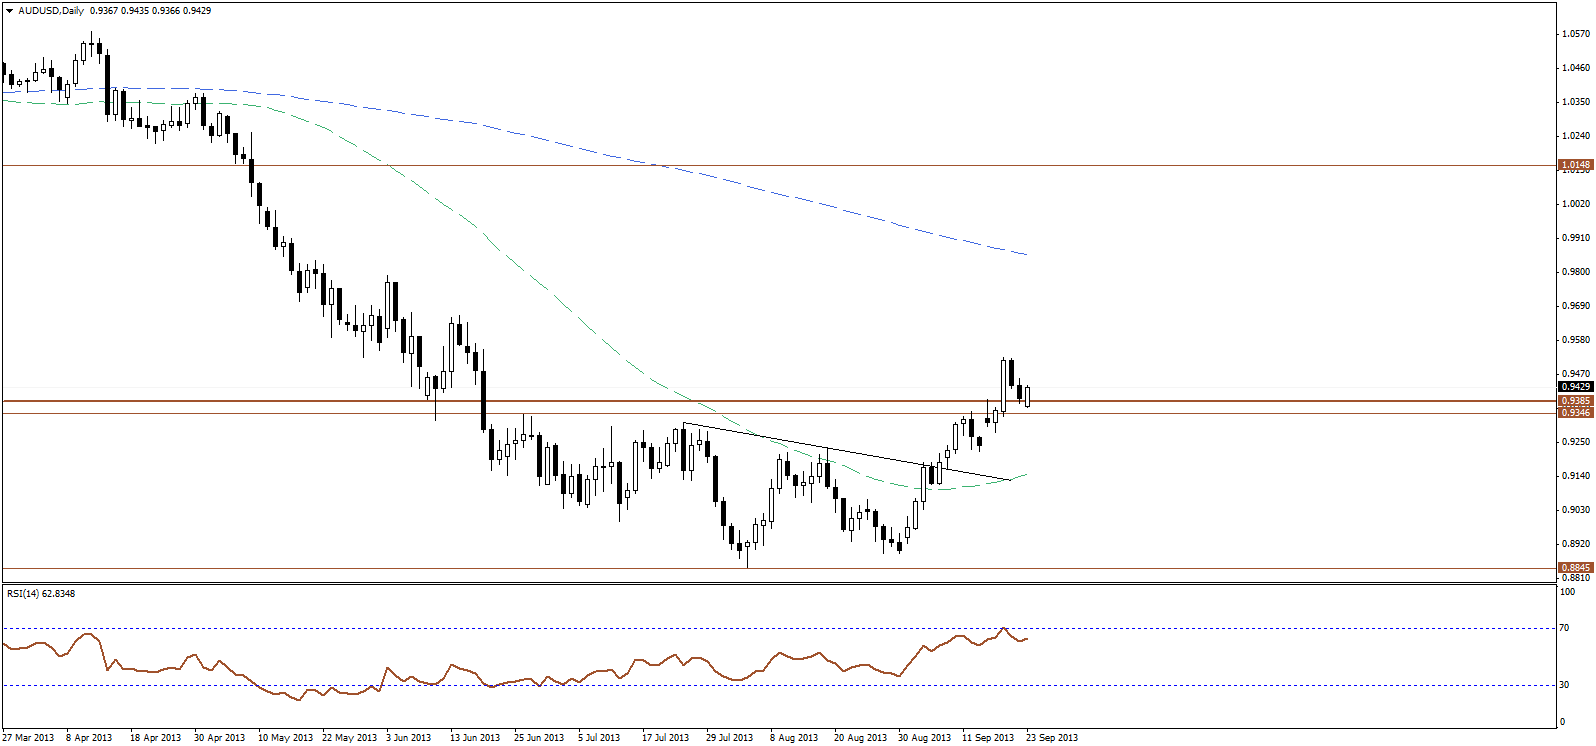 AUD/USD" border="0" height="746" width="1596">
Despite the strong downside pullback, the pair remains within a bullish breakout mode, as price has completed a retest to the broken resistance-turned-support at 0.9385 level, we consider the move as a mere retesting process ahead of resuming the overall bullish breakout. Over intraday basis, 0.9365-support should remain intact for the intraday bullish bias to remain dominant, while the overall bullish scenario requires 0.9220 to hold. AUD/USD_S&R" title="AUD/USD_S&R" src="https://d1-invdn-com.akamaized.net/content/pic7ff3e26c93e5ce8c8ebd05b4055d6d53.png" height="746" width="1596">