
EUR/USD - European Session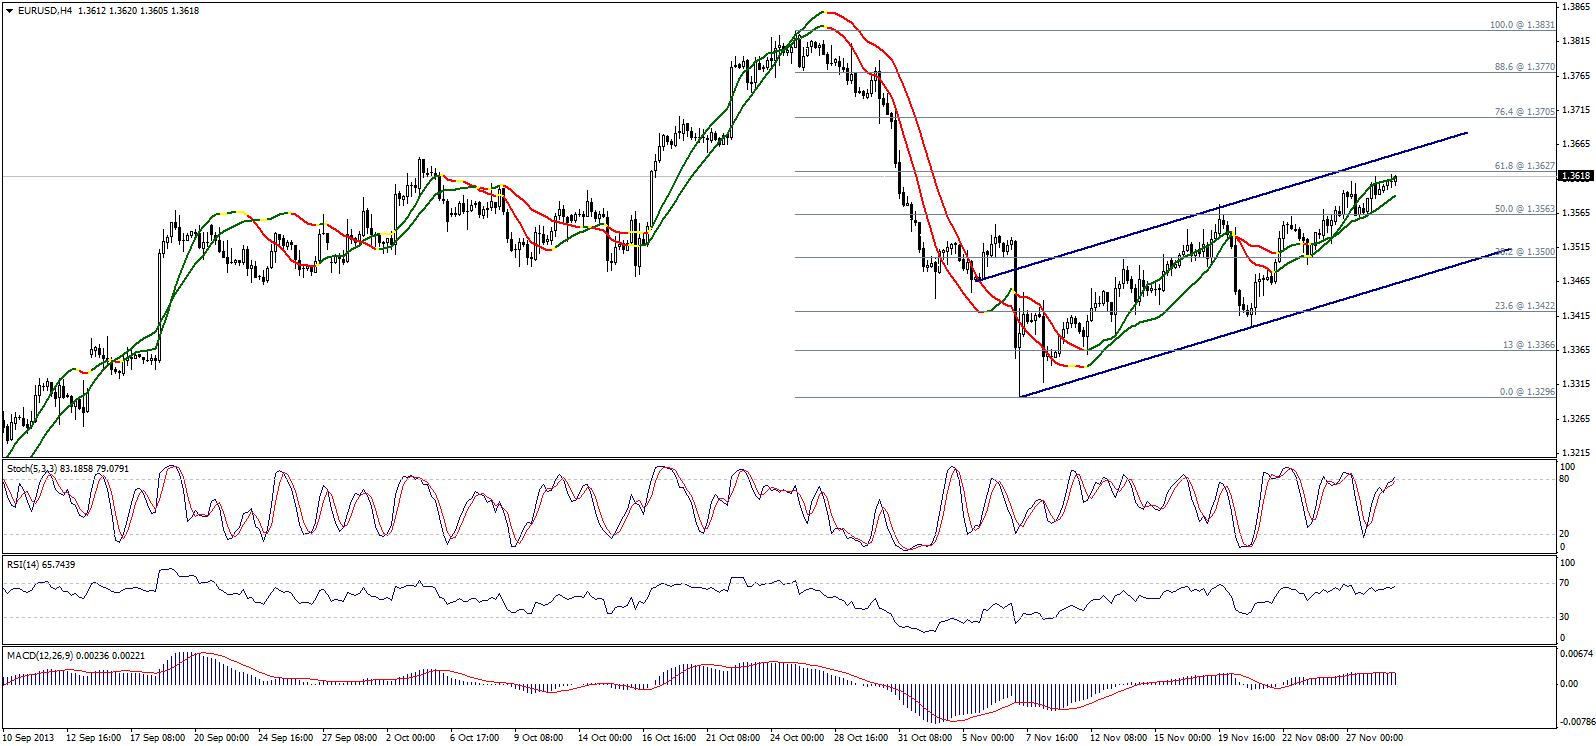
The pair extended the positive trading, whereas it approached 61.8% correction at 1.3625 – 1.3630. The possibility of extending the upside move is valid today but the pair has to breach 1.3630 to trigger another bullish wave targeting 1.3705 and perhaps 1.3770 levels later. Anyhow, trading above 1.3500 is positive but consolidating above 1.3555 is required over intraday basis today to keep the bullish possibility.
GBP/USD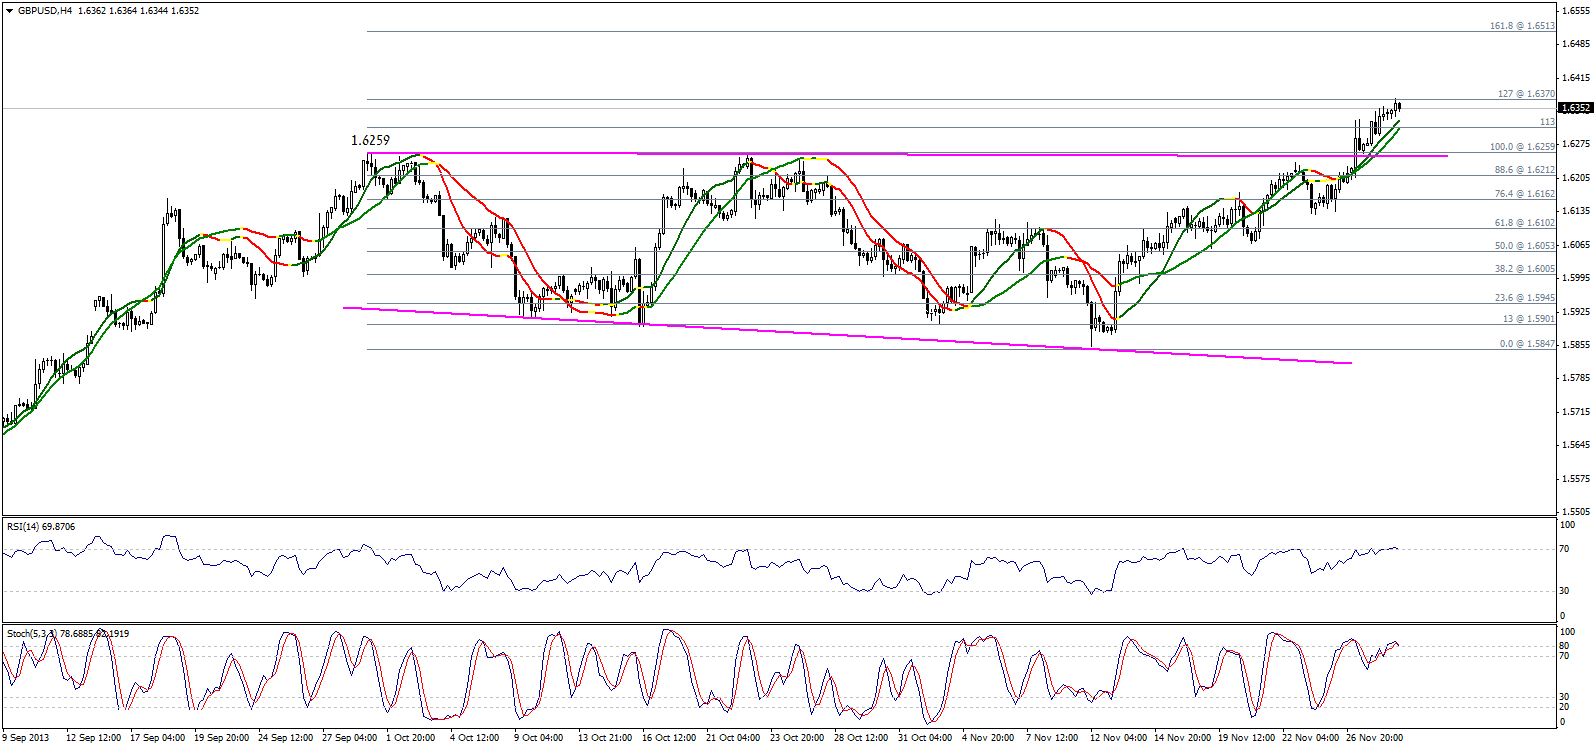
The pair touched 127.2% Fibonacci level at 1.6370 then slightly dropped. But the current slight downside move is still limited above Linear Regression Indicators and the previous top at 1.6259 favoring the possibility of keeping the upside move valid, Trading above the referred to top is positive, but breaching 1.6370 could trigger a strong bullish rally today. We hold on to our positive expectations supported by the bullish technical classical formation showing on graph.
USD/JPY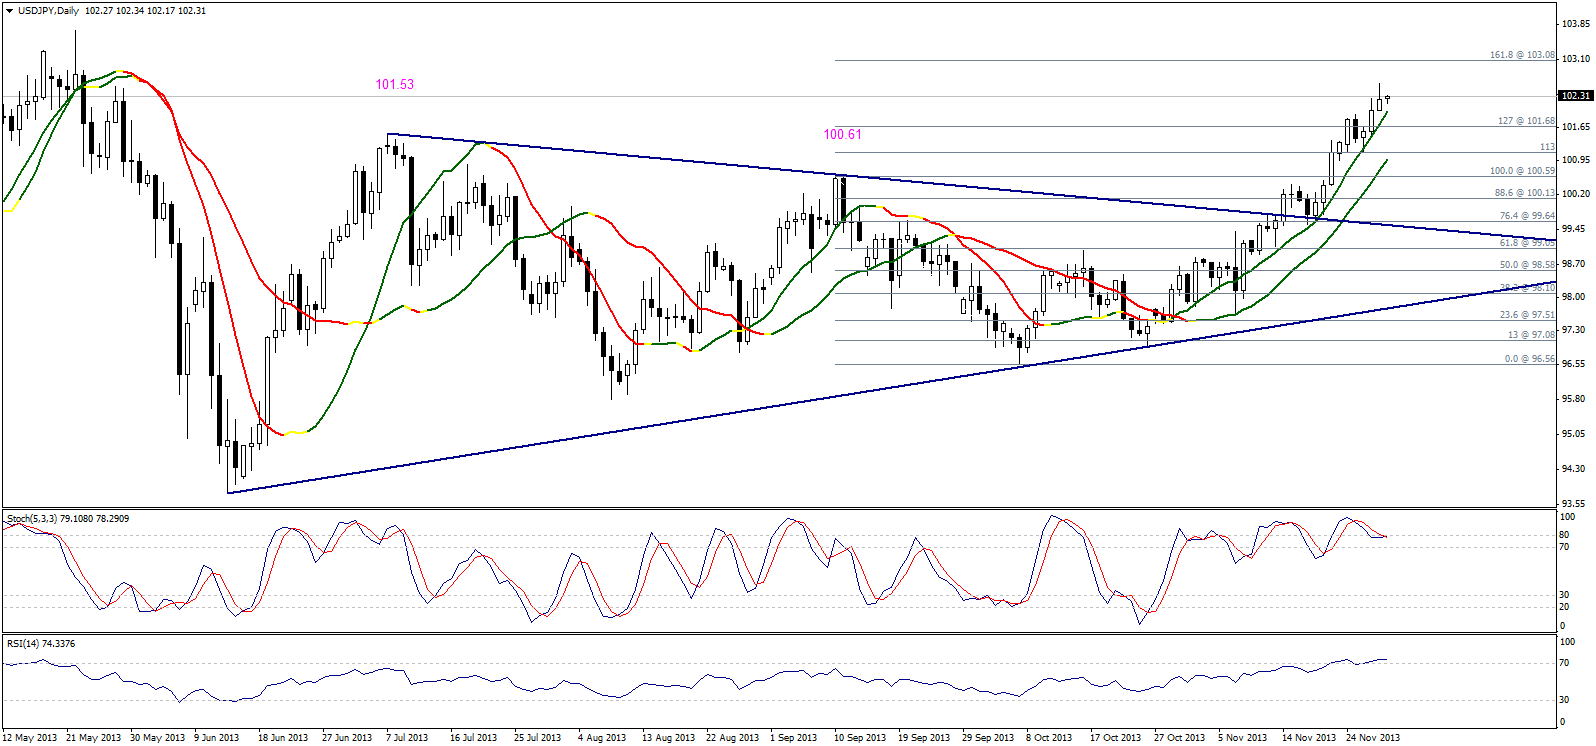
The pair consolidated above Linear Regression Indicator 34 as it is gradually approaching the target at 103.10 represented in 161.8% correction as showing on graph. Despite that Stochastic is overbought, but we see negative signals showing keeping the bullish possibility valid. Breaking 101.65 could fail our expectations, otherwise the upside move remains intraday valid.
USD/CHF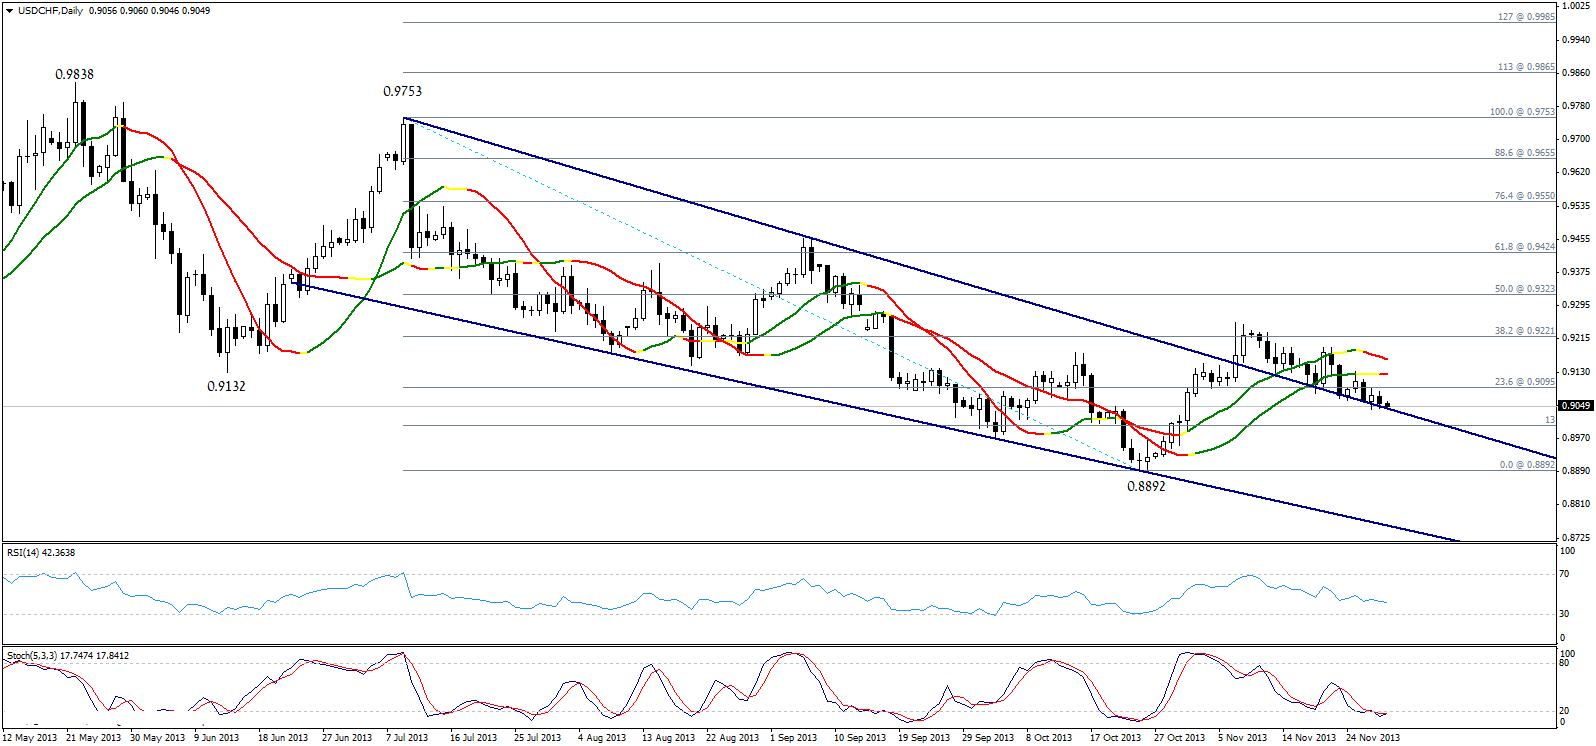
The pair is gradually dropping affected by stabilizing below 23.6% correction at 0.9095. Meanwhile, the pair is touching the resistance level that was breached and turned to support from the upside without stabilizing below that level as showing on graph. There is a contradiction between Stochastic that is showing oversold signals, and RSI that is showing a negative bias of the momentum that is trading below line 50. Therefore, we prefer to remain intraday neutral today waiting for better confirmation signals. 
USD/CAD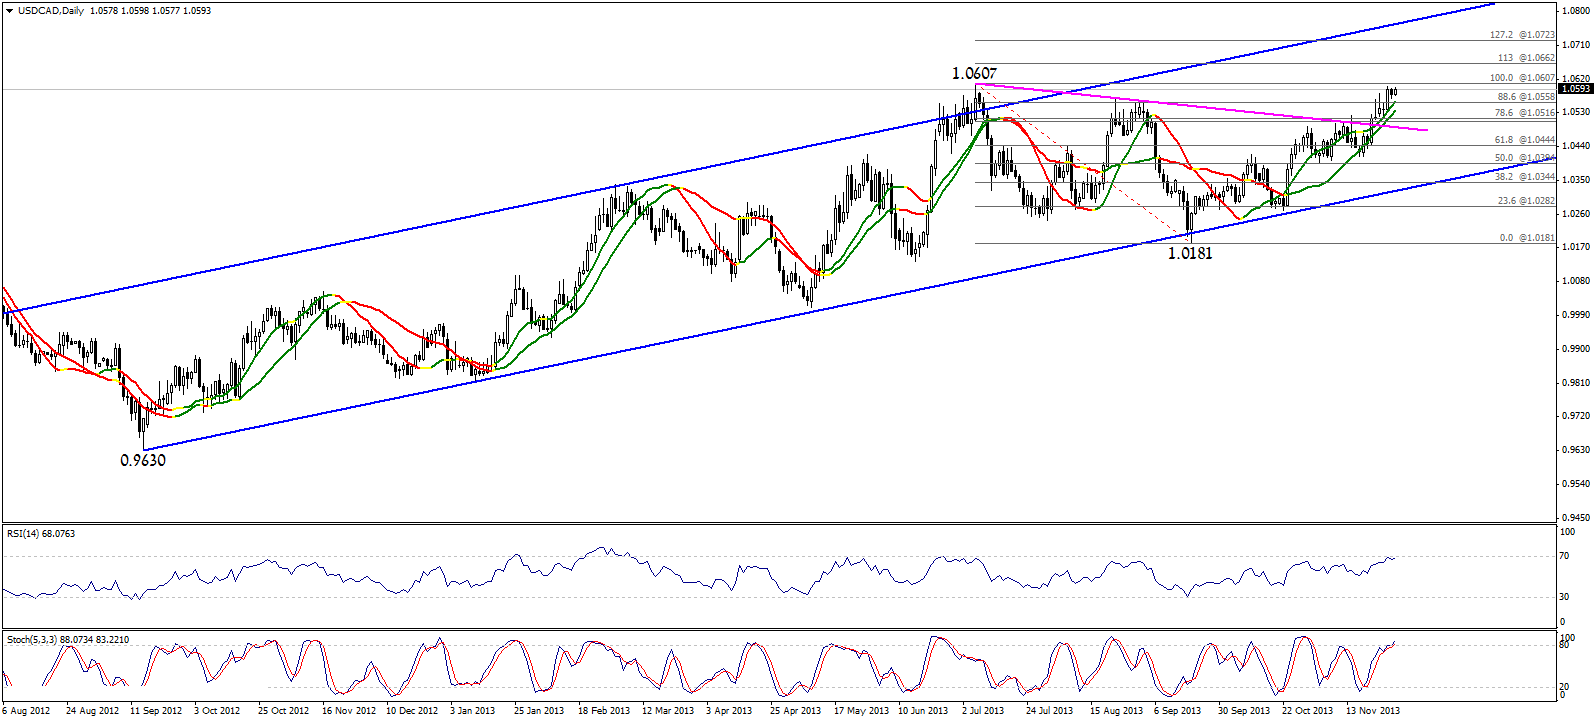
The pair witnessed yesterday a slight correction then moved to the upside approaching the previous top at 1.0607 levels. The upside move will extend supported by Linear Regression Indicators, whereas the pair is moving further to the upside towards 1.0665 and perhaps 1.0725 later represented in Fibonacci levels within the ascending channel showing on graph. Stability above 1.0515 is significant to keep the bullish bias as it won’t allow the pair to react to the overbought signals on momentum indicators.
AUD/USD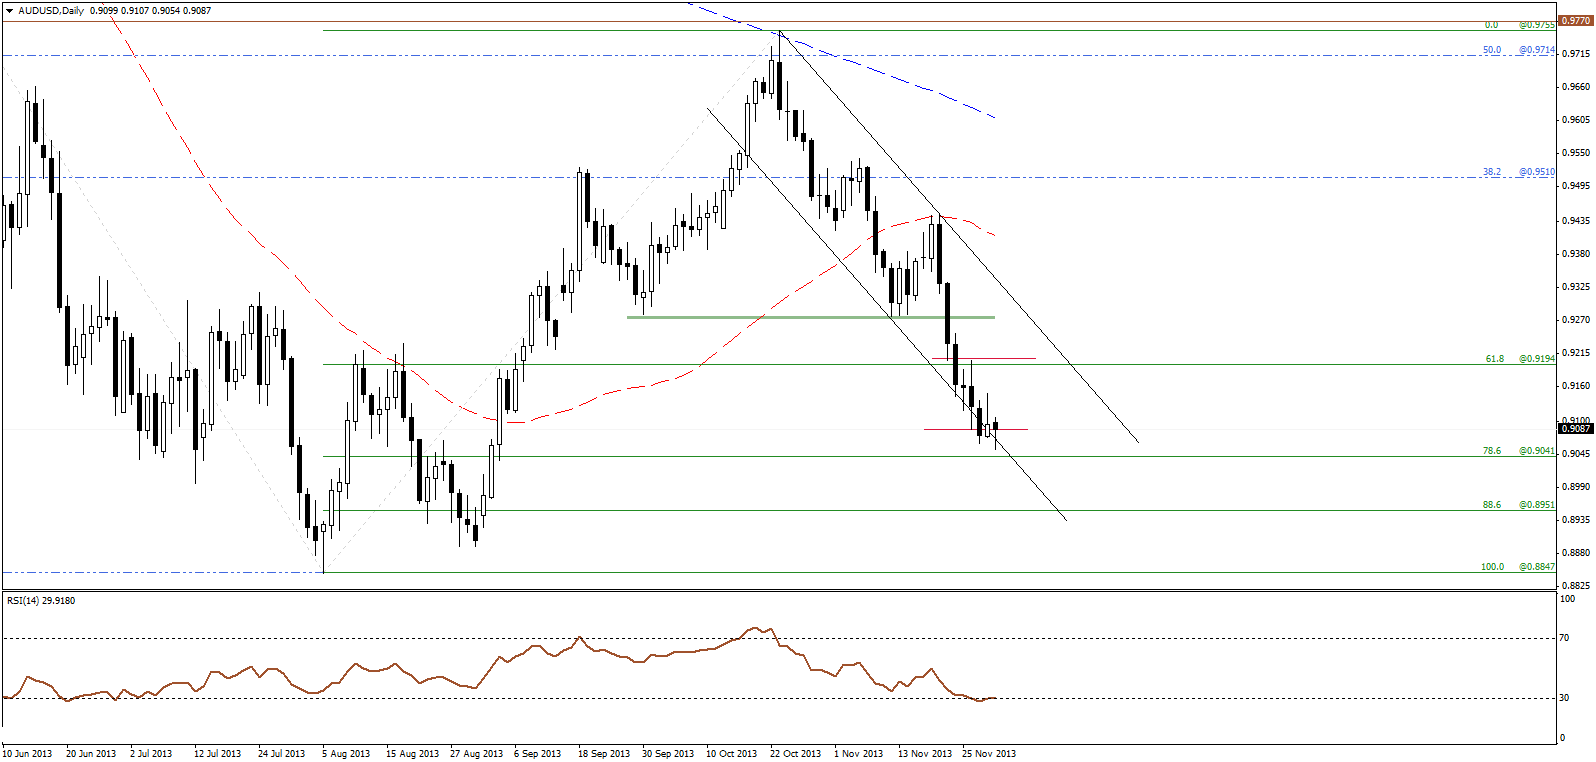
The pair maintains stability above the ascending channel showing on graph so we still favor the bullish intraday bias that targets retesting 0.9195 then 0.9275 levels before moving back to the downside. Breaking 0.9070 then 0.9040 will push the pair to extend the overall bearish move without the need to the suggested bullishness.
NZD/USD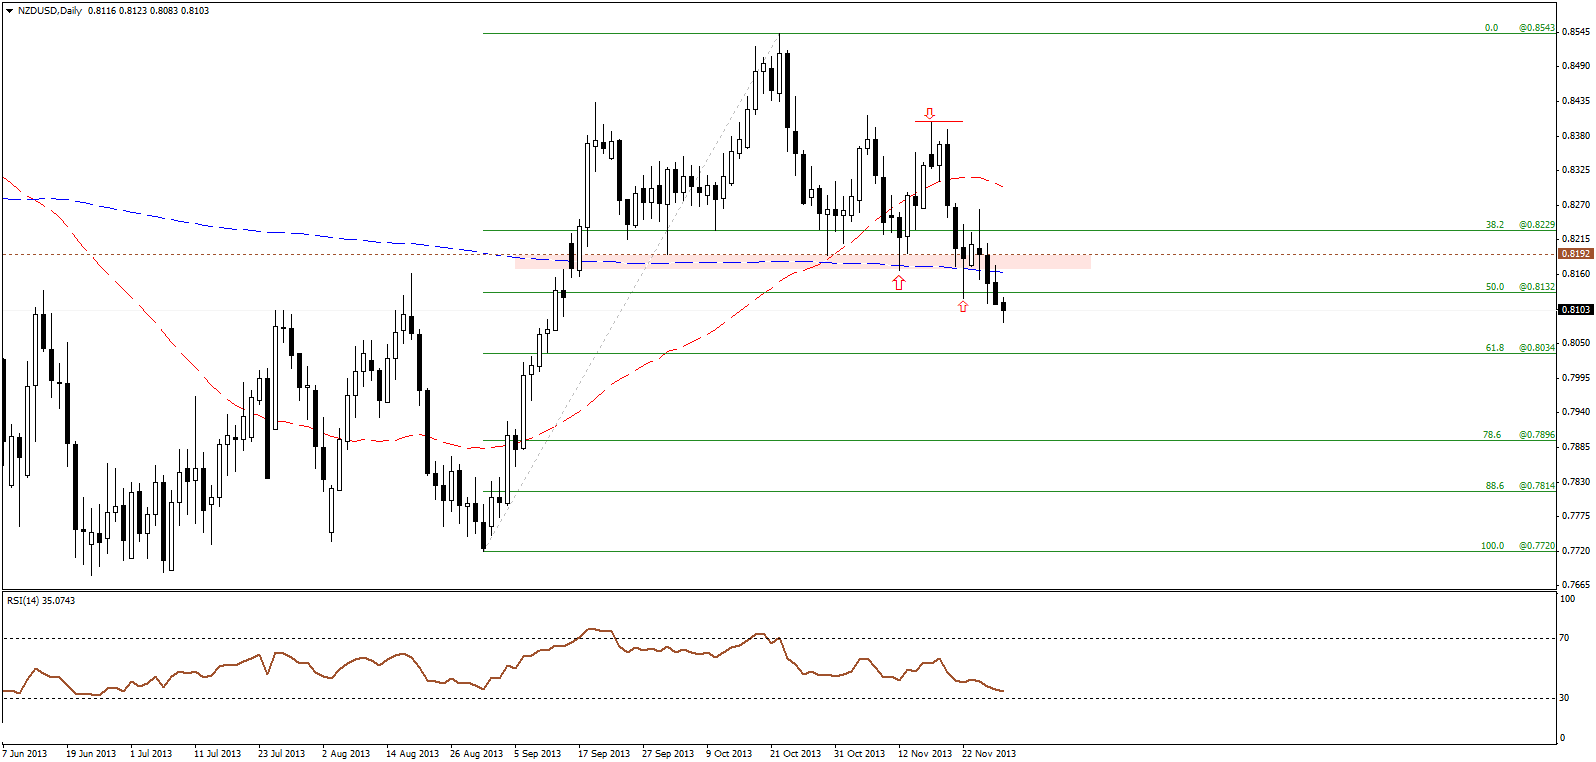
The negative pressure still dominates the pair’s trading and is currently stabilizing below 50% Fibonacci of the upside move showing on graph, forcing us to keep our bearish expectations that depends on the negative effect of the Head and Shoulders Pattern showing on graph. Our awaited targets start at 0.8035 then 0.7895, while achieving them requires stability below 0.8230 levels.
- English (UK)
- English (India)
- English (Canada)
- English (Australia)
- English (South Africa)
- English (Philippines)
- English (Nigeria)
- Deutsch
- Español (España)
- Español (México)
- Français
- Italiano
- Nederlands
- Português (Portugal)
- Polski
- Português (Brasil)
- Русский
- Türkçe
- العربية
- Ελληνικά
- Svenska
- Suomi
- עברית
- 日本語
- 한국어
- 简体中文
- 繁體中文
- Bahasa Indonesia
- Bahasa Melayu
- ไทย
- Tiếng Việt
- हिंदी
Daily Technical Report : November 29, 2013
Published 11/29/2013, 02:40 AM
Updated 07/09/2023, 06:31 AM
Daily Technical Report : November 29, 2013
3rd party Ad. Not an offer or recommendation by Investing.com. See disclosure here or
remove ads
.
Latest comments
Install Our App
Risk Disclosure: Trading in financial instruments and/or cryptocurrencies involves high risks including the risk of losing some, or all, of your investment amount, and may not be suitable for all investors. Prices of cryptocurrencies are extremely volatile and may be affected by external factors such as financial, regulatory or political events. Trading on margin increases the financial risks.
Before deciding to trade in financial instrument or cryptocurrencies you should be fully informed of the risks and costs associated with trading the financial markets, carefully consider your investment objectives, level of experience, and risk appetite, and seek professional advice where needed.
Fusion Media would like to remind you that the data contained in this website is not necessarily real-time nor accurate. The data and prices on the website are not necessarily provided by any market or exchange, but may be provided by market makers, and so prices may not be accurate and may differ from the actual price at any given market, meaning prices are indicative and not appropriate for trading purposes. Fusion Media and any provider of the data contained in this website will not accept liability for any loss or damage as a result of your trading, or your reliance on the information contained within this website.
It is prohibited to use, store, reproduce, display, modify, transmit or distribute the data contained in this website without the explicit prior written permission of Fusion Media and/or the data provider. All intellectual property rights are reserved by the providers and/or the exchange providing the data contained in this website.
Fusion Media may be compensated by the advertisers that appear on the website, based on your interaction with the advertisements or advertisers.
© 2007-2024 - Fusion Media Limited. All Rights Reserved.