
 EUR/USD" title="EUR/USD" height="242" width="474">
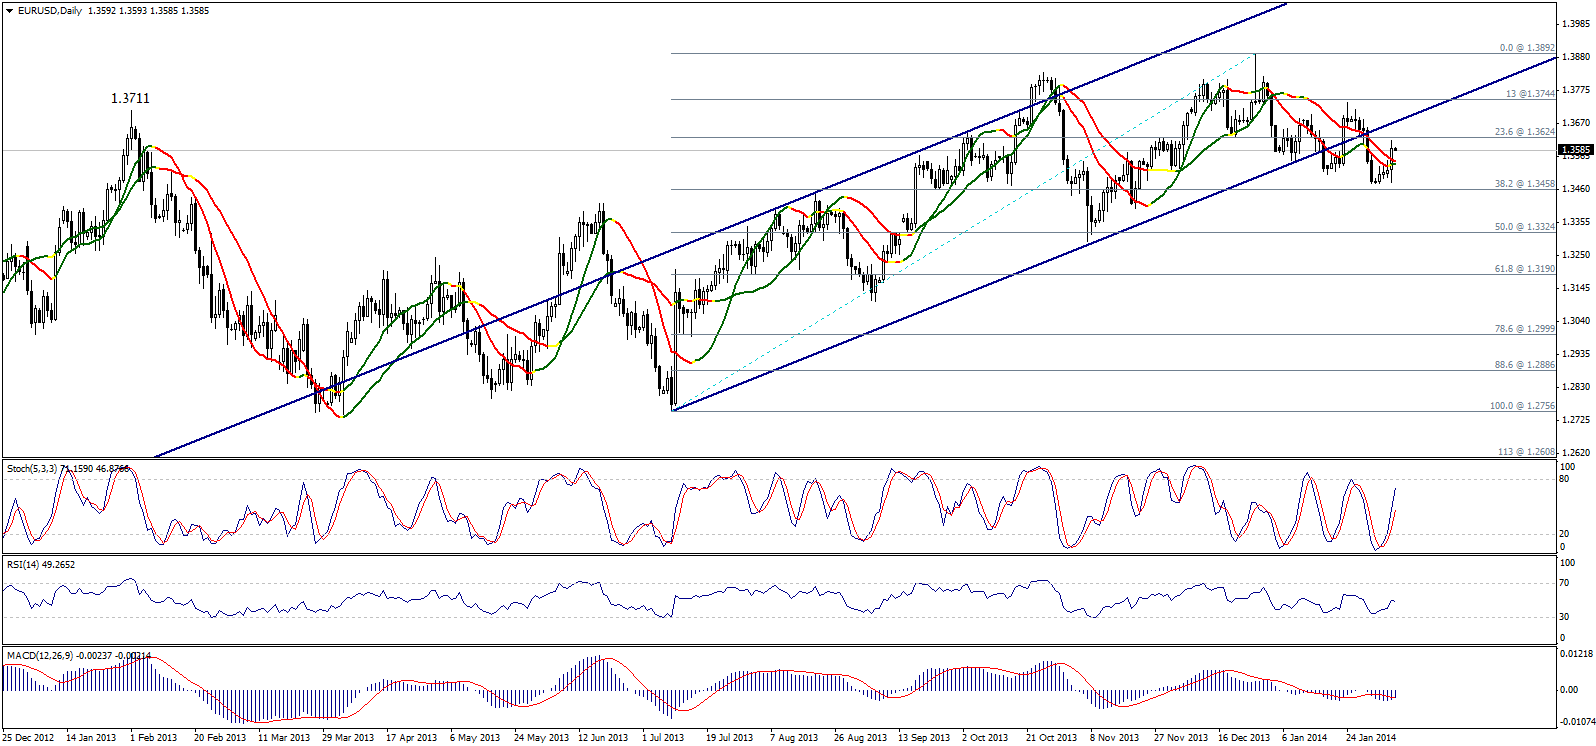
The pair moved to the upside yesterday but remained limited below 1.3625 keeping the possibility of bringing back the downside move in light of breaking the key support level of the ascending channel as showing on graph. The pair is stable above Linear Regression Indicators where we cannot bet on a downside move now.
Therefore, we wait to break again 1.3635 levels to bring negativity back. On the other hand, breaching 1.3625 will trigger a new attempt to the upside.

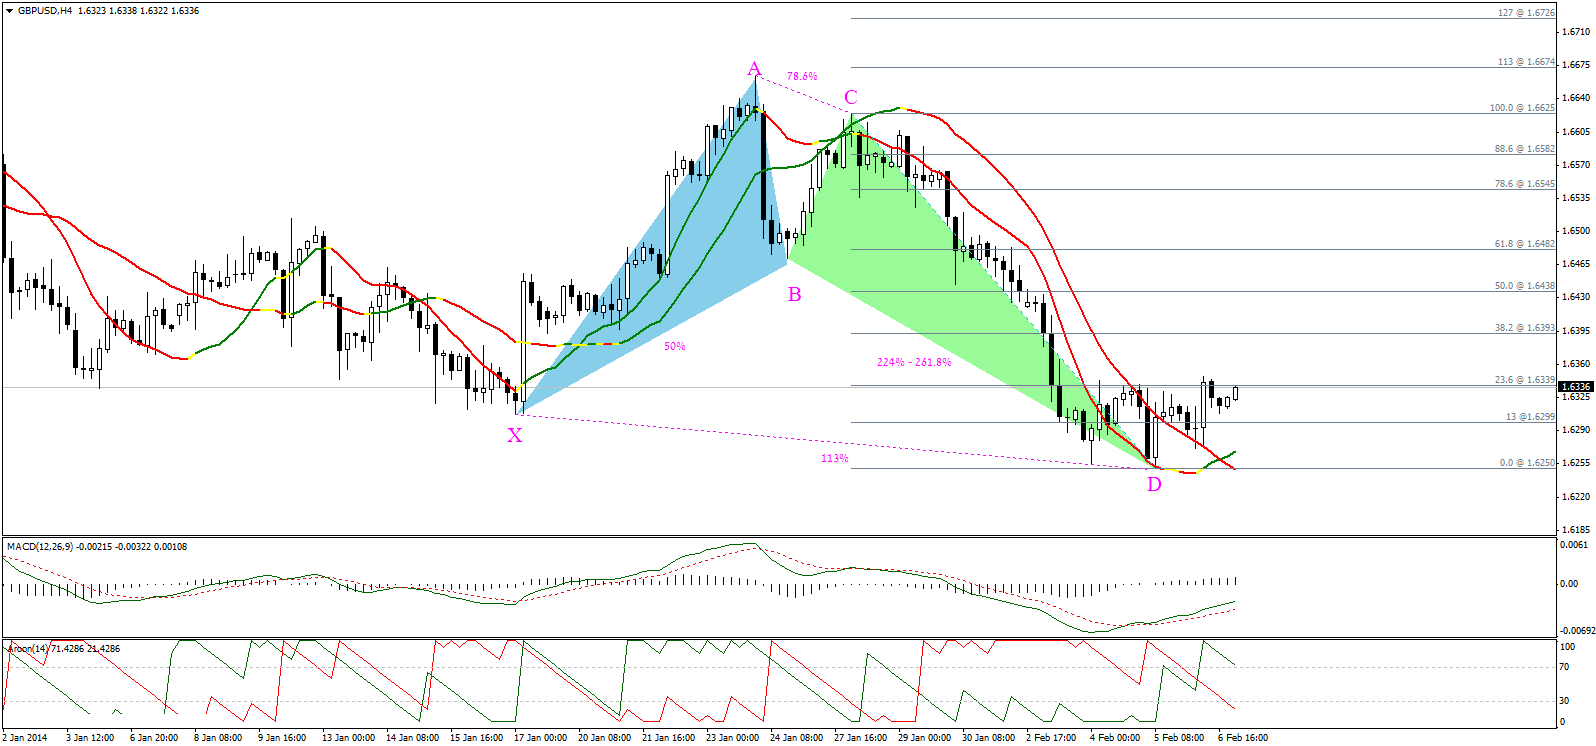
Despite the overall negativity, the pair confirmed the bullish alternative harmonic Bat Pattern that remains valid by stabilizing above 1.6250. Linear Regression Indicators crossed over encouraging us to use this pattern today, as AROON is showing positivity and MACD is moving to the upside.
Therefore, we bet on an upside move and stabilizing above 1.6340 shall push the pair towards 1.6395. Breaching 1.6395 will trigger further bullishness towards 1.6440. On the other hand, we cannot ignore that breaking 1.6250 will weaken the intraday upside move today.

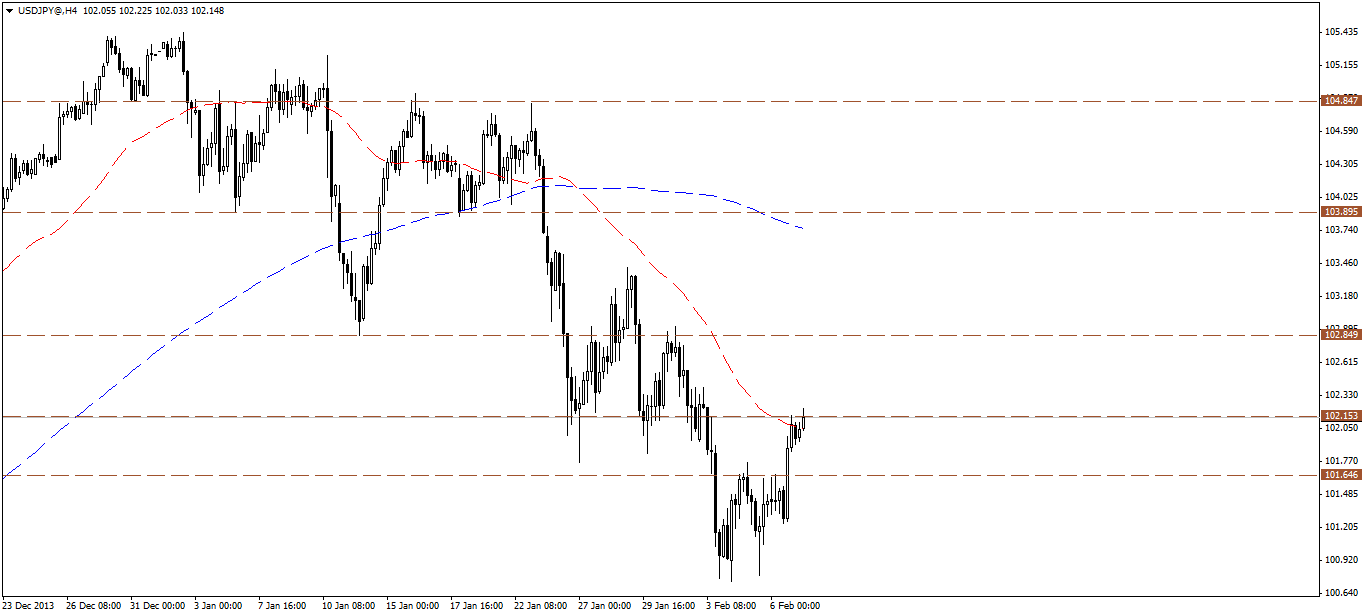
USDJPY rebounded yesterday, breaking 101.65 resistance level and retesting the next resistance at 102.15. Breaking 101.65 may have completed a minor bottom and price may correct to the upside further. Accordingly, we have a bullish bias over intraday basis.

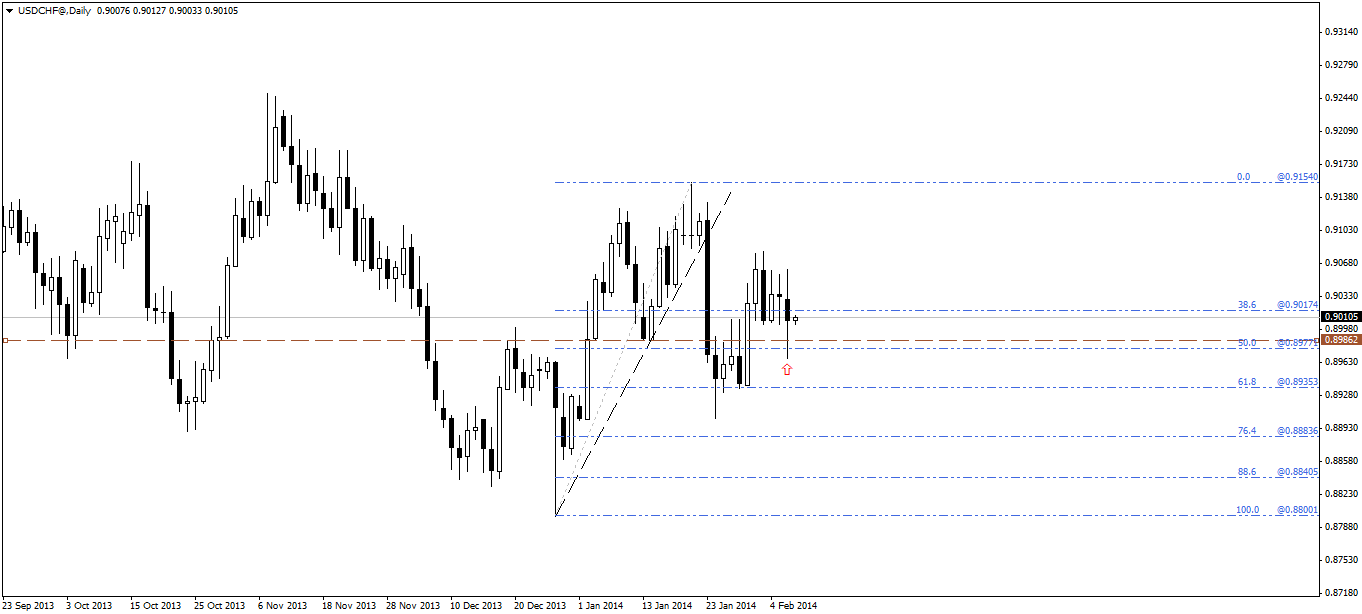
USDCHF dipped sharply lower below 0.9000 level yesterday, however price rebounded again to close the trading session above the level, forming a major candle with major shadows. Accordingly, we prefer to wait for a confirmation today, as price action hints indecision in the meantime.
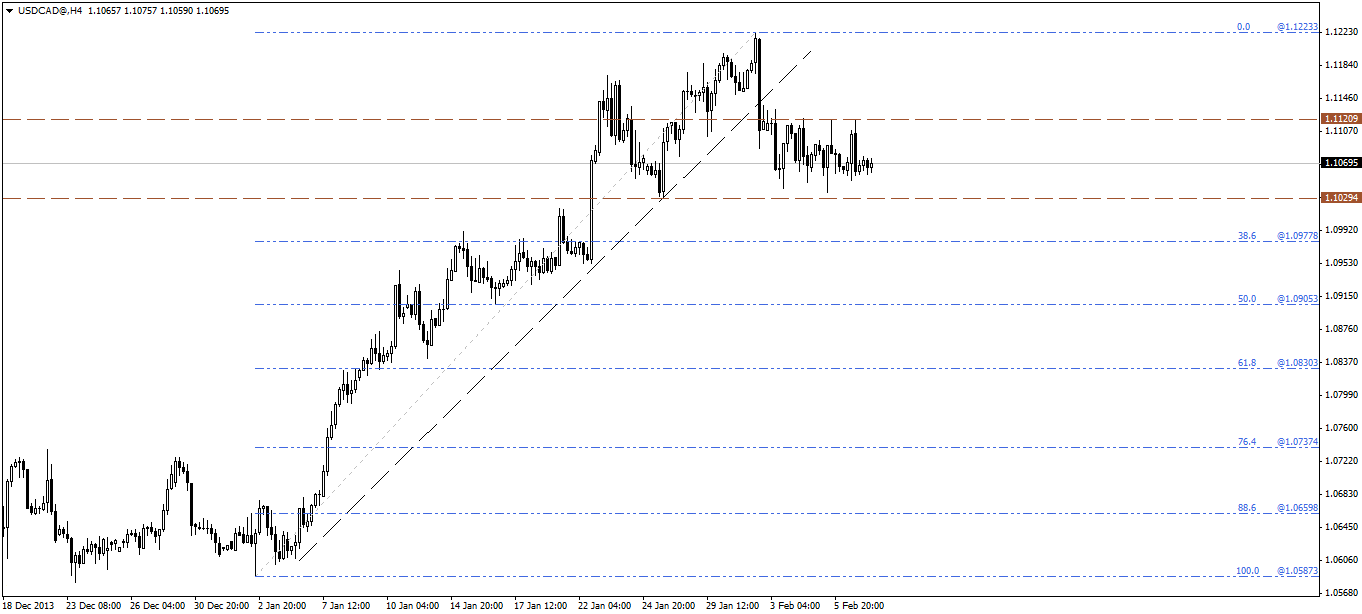
USDCAD fluctuated yesterday, as price retested 1.1120 resistance level before reversing again. The pair is trading in a very tight range, where we need a break below 1.1030 support for the bearish wave to extend further. A break above 1.1120 resistance might resume the overall bulish bias.

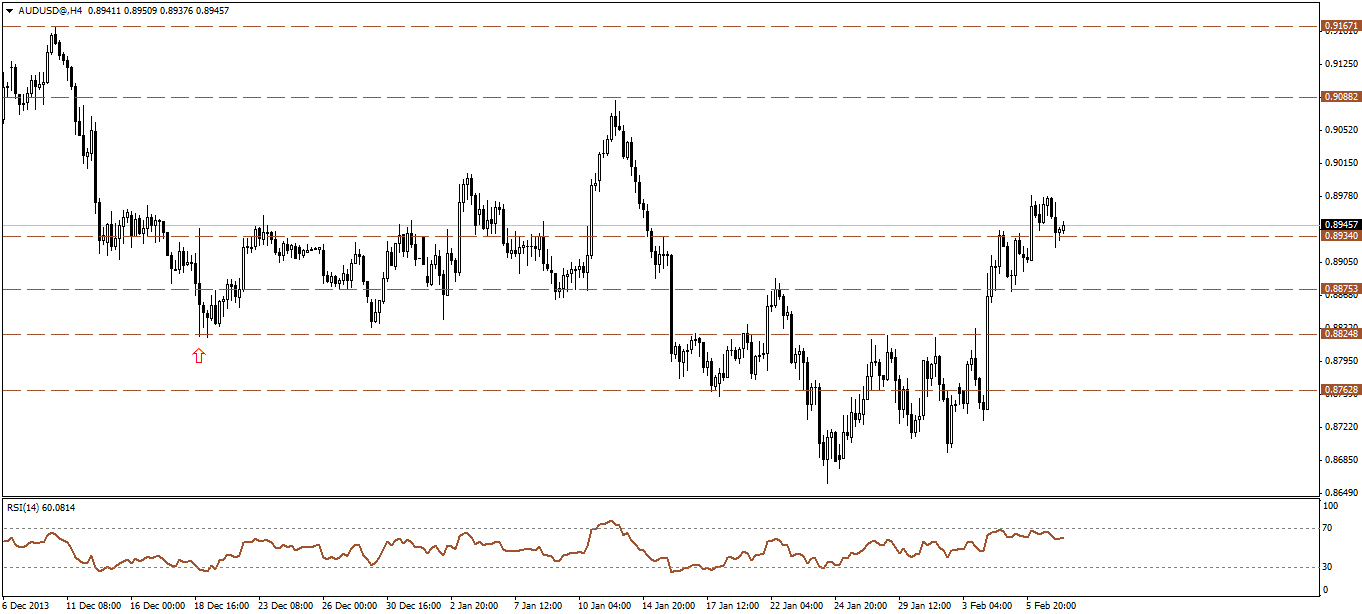
AUDUSD corrects slightly lower, towards 0.8935 support level, where we still see further upside and favor the resumption of the bullish wave, holding above 0.8875 should keep the intraday bullish bias intact, targeting levels around 0.9000 and 0.9080.

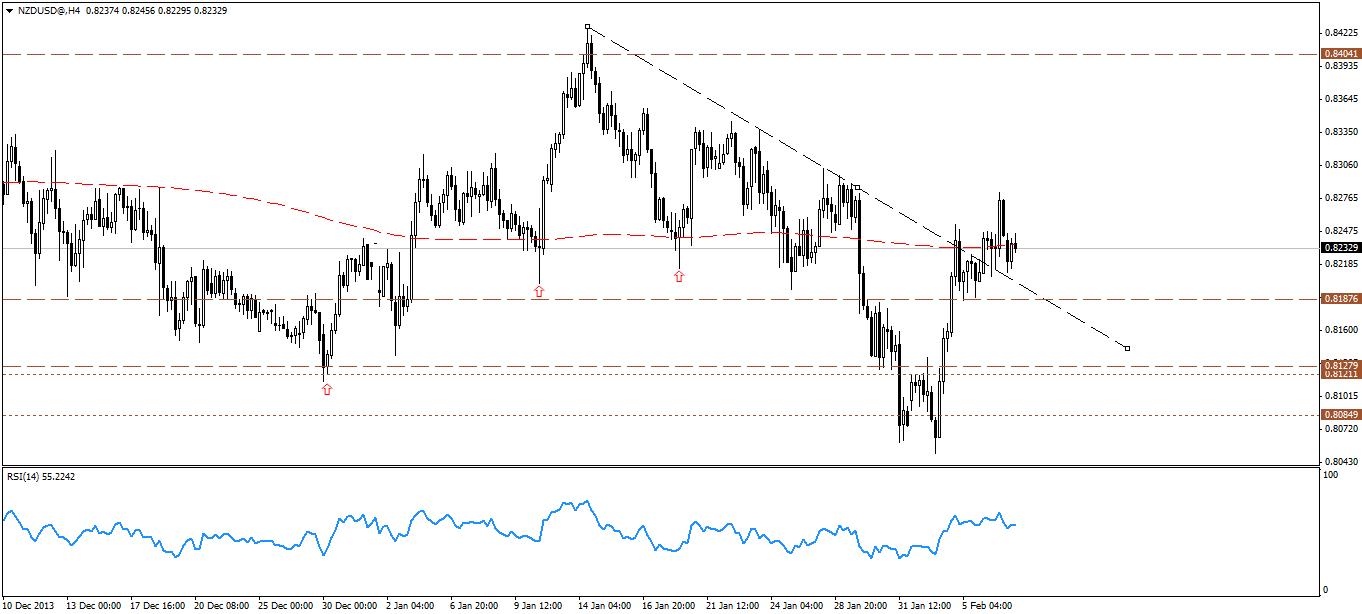
NZDUSD touched levels around 0.8280 before reversing to the downside, however price remains above the broken descending resistance and key short term horizontal support at 0.8185, accordingly, we maintain our bullish bias, looking for further upside.

3rd party Ad. Not an offer or recommendation by Investing.com. See disclosure here or
remove ads
.