
EUR/USD - Weekly Report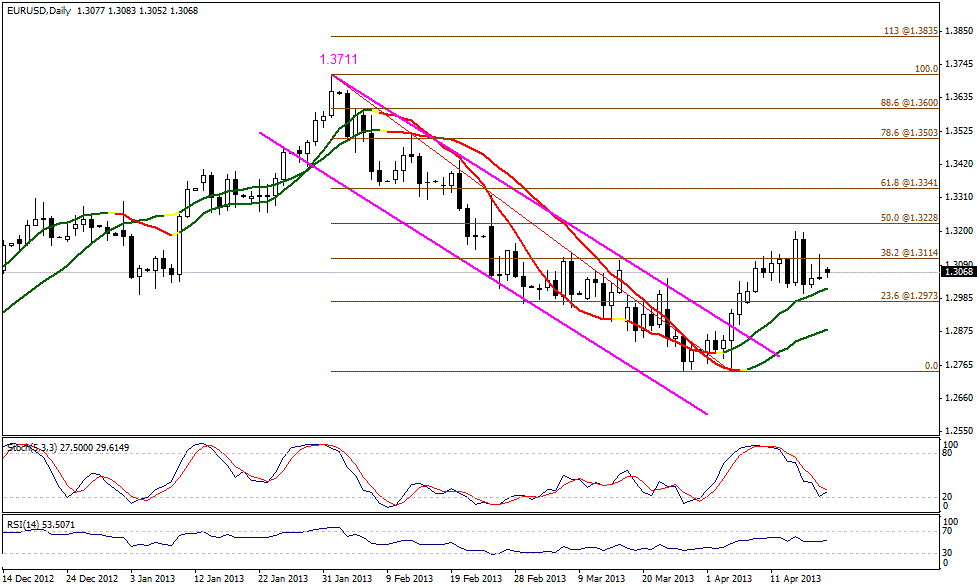 EUR/USD" title="EUR/USD" width="911" height="662">
The pair fluctuated sharply last week pushing the pair to trade again below resistance level 1.3115. But we find the pair stable above 23.6% correction at 1.2970, as Linear Regression Indicators tends to be positive forcing us to think that we are in front a new attempt to the upside this week. Positivity requires not breaking 1.2970 levels, whereas stability below it might fail the positivity.
The trading range for this week is among the key support at 1.3035 and key resistance at 1.3230.
The general trend over short term basis is to the downside targeting 1.2560 as far as areas of 1.3270 remains intact.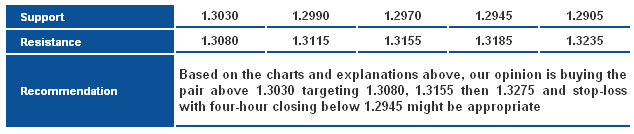 EUR/USD_S&R" title="EUR/USD_S&R" width="634" height="134">
GBP/USD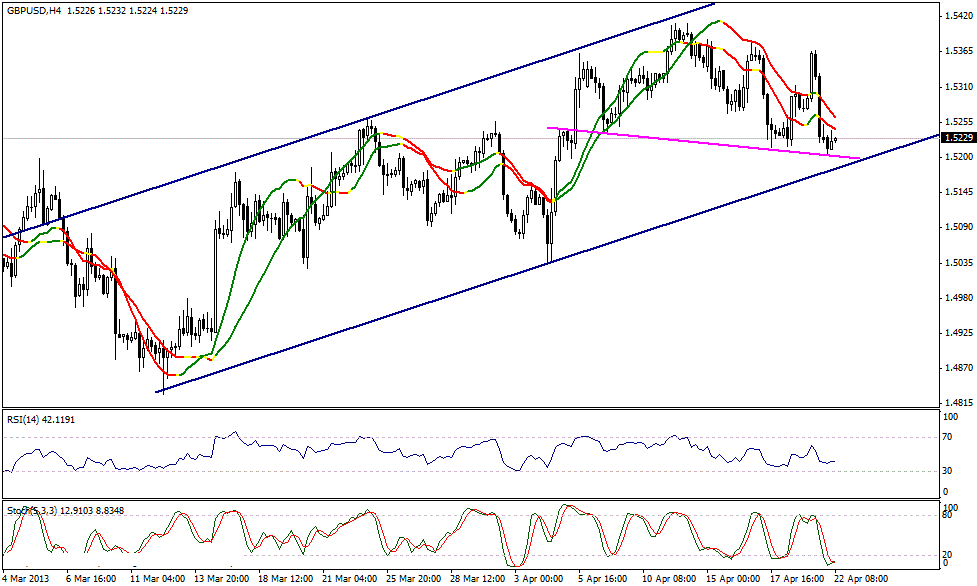 GBP/USD" title="GBP/USD" width="911" height="662">
As per the technical classical analysis, the pair is still trading within an ascending channel and the bearish move was halted close to key support level of the channel as Stochastic is showing oversold signals. Linear Regression Indicators are negative and covering the pair’s movement from the upside. Breaking 1.5185 levels might form a negative technical pattern; on the contrary, the pair must trade stably above 1.5305 to support the upside move again. Therefore, we prefer to remain intraday neutral in our weekly report pointing out the importance of our upcoming daily reports waiting for confirmation signals.
The trading range for this week is among key support at 1.5030 and key resistance at 1.5490.
The general trend over short term basis is to the downside as far as areas of 1.6875 remains intact targeting 1.4225.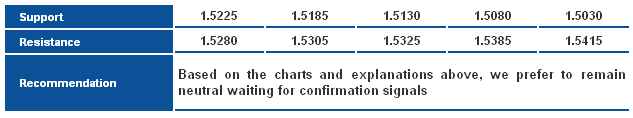 GBP/USD_S&R" title="GBP/USD_S&R" width="633" height="118">
USD/JPY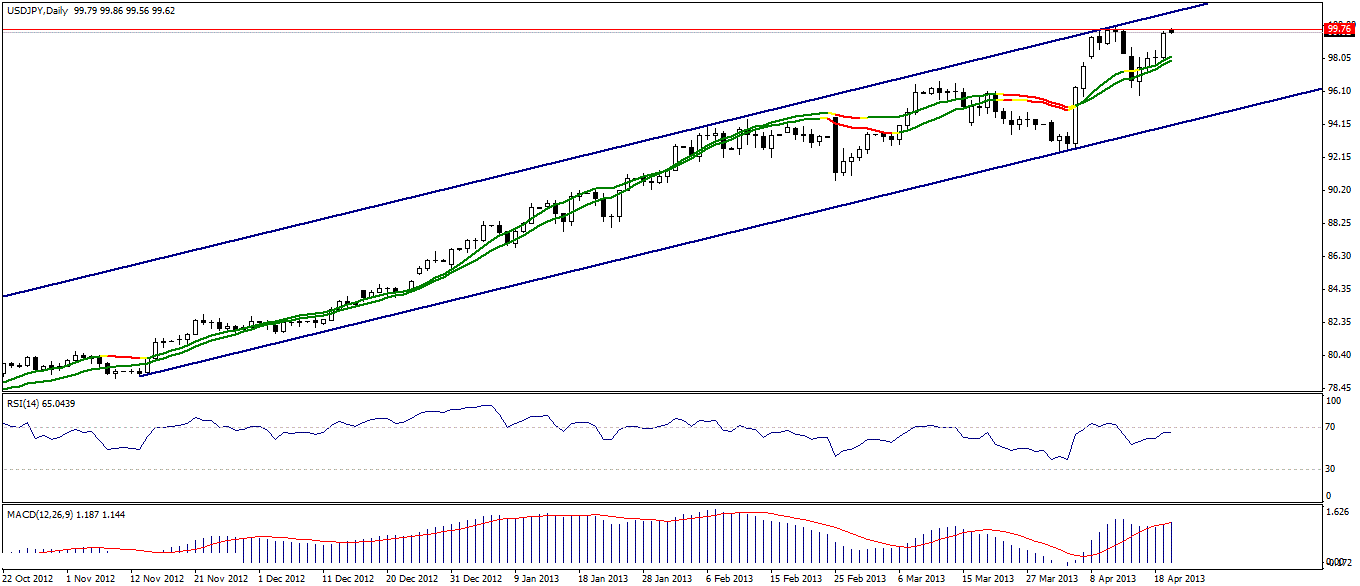 USD/JPY" title="USD/JPY" width="911" height="662">
The pair opened positively this week, as we see it stable on levels close to significant resistance levels extending around 99.85. In general, the pair is in the ascending channel shown on graph and Linear Regression Indicators are positive supporting extending positivity. As for this week, trading above 98.80 levels keep the pair’s positivity keeping in mind the importance of breaching 99.85 and stabilizing above it to support this technical outlook.
The trading range for this week is among key support at 97.60 and key resistance at 101.60.
The general trend over short term basis is to the upside as far as areas of 84.00 remain intact targeting 100.00.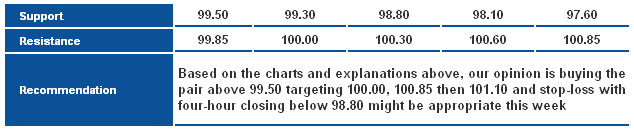 USD/JPY_S&R" title="USD/JPY_S&R" width="634" height="133">
USD/CHF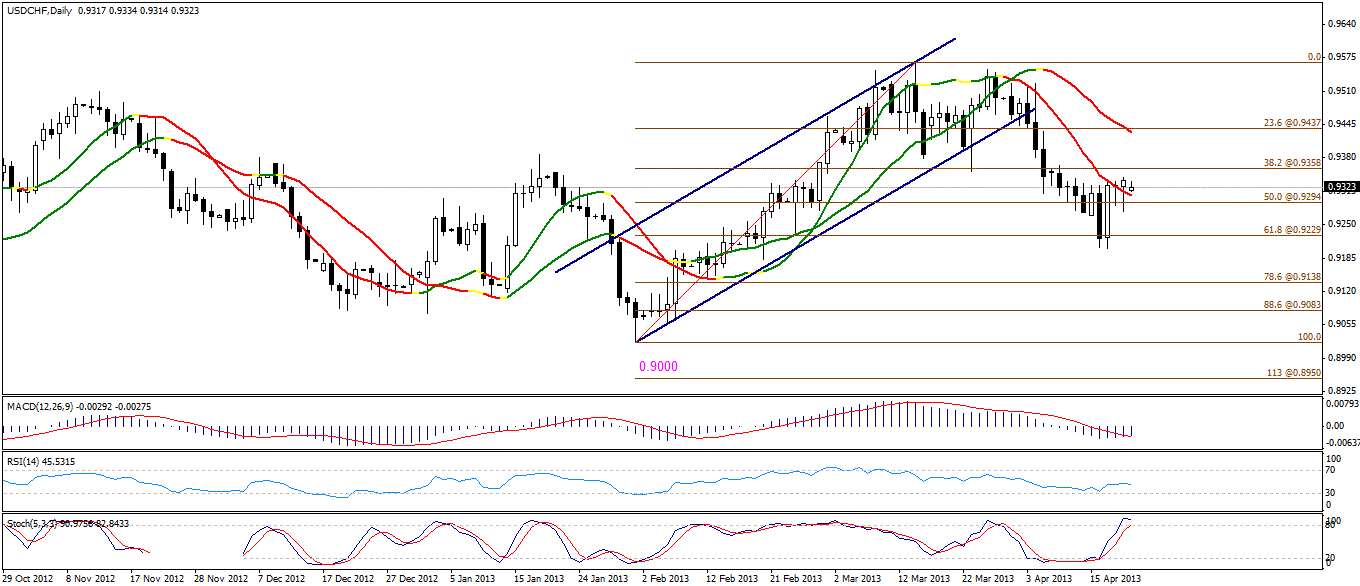 USD/CHF" title="USD/CHF" width="911" height="662">
The pair rebounded sharply to the upside during last week and is table above 0.9295 which is positive and might push the pair further to the upside. Linear Regression Indicators are negative and Stochastic is showing overbought signals; as the Double Top Pattern’s affect is still valid. Due to the abovementioned, we prefer to remain neutral in our weekly report waiting for new confirmation signals.
The trading range for this week is among key support at 0.9170 and key resistance at 0.9495.
The general trend over short term basis is to the downside stable at levels 0.9775 targeting 0.8860. USD/CHF_S&R" title="USD/CHF_S&R" width="635" height="114">
USD/CAD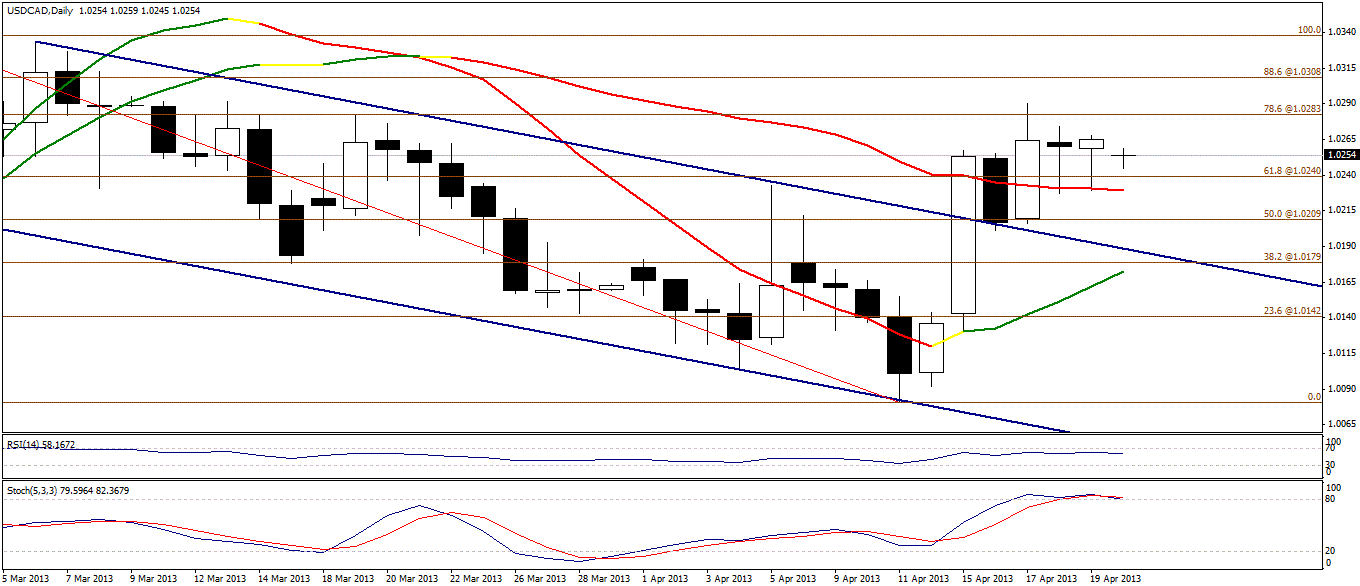 USD/CAD" title="USD/CAD" width="911" height="662">
The pair stabled above key resistance level of the downside move and above 1.0215 levels as shown on graph, which is positive especially that it stabled above Linear Regression Indicators. Therefore, the bullish move might extend this week unless levels 1.0185 were broken and the pair stabled below it.
The trading range for this week is between the key support at 1.0165 and the key resistance at 1.0445.
The general trend over short term basis is to the upside with steady daily closing above levels 0.9800 targeting 1.0485.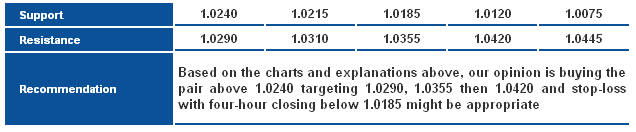 USD/CAD_S&R" title="USD/CAD_S&R" width="636" height="132">
AUD/USD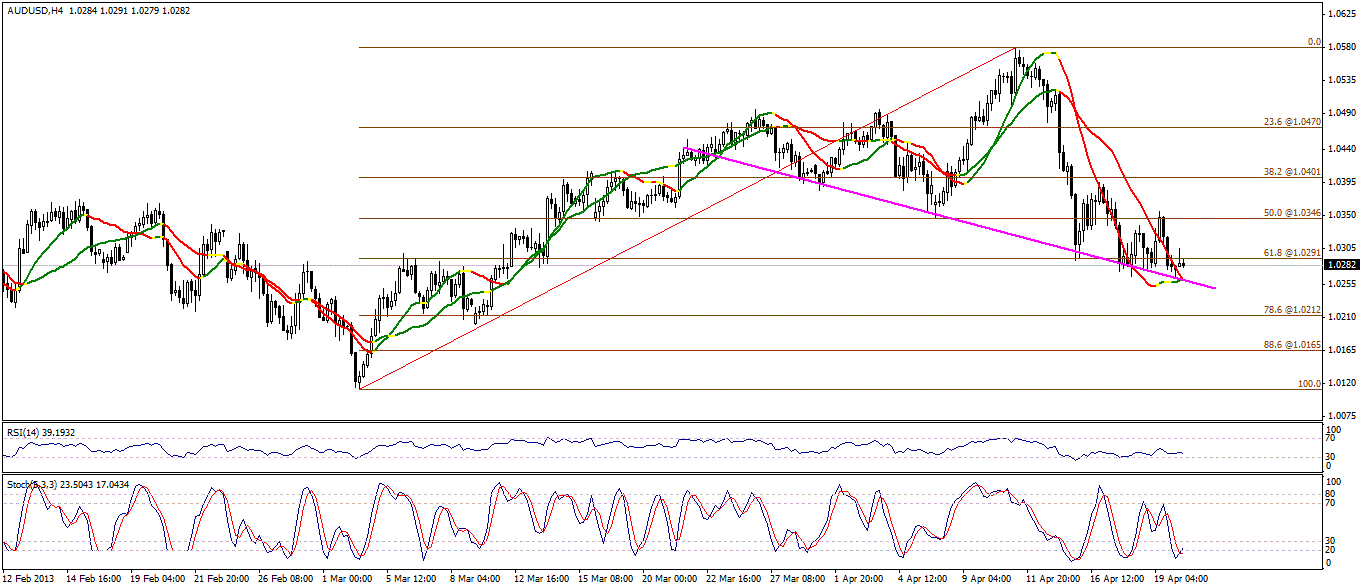 AUD/USD" title="AUD/USD" width="911" height="662">
AUD/USD is trading below 61.8% correction at 1.0290 however above Linear Regression Indicators. Stochastic reflects oversold signals and the Relative Strength Index demonstrates an upside reversal. In order to confirm all of these positive signals, trading must go back above 1.0290 but, in contrast, the downtrend will extend if the pair breaks the lower line of the downside bias shown in pink.
- Trading range expected this week is between the key support at 1.0165 and the key resistance 1.0465.
- Short-term trend is downside targeting 0.9400 if 1.0710 remains intact.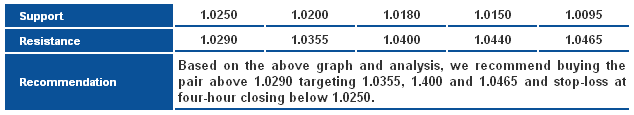 AUD/USD_S&R" title="AUD/USD_S&R" width="634" height="115">
NZD/USD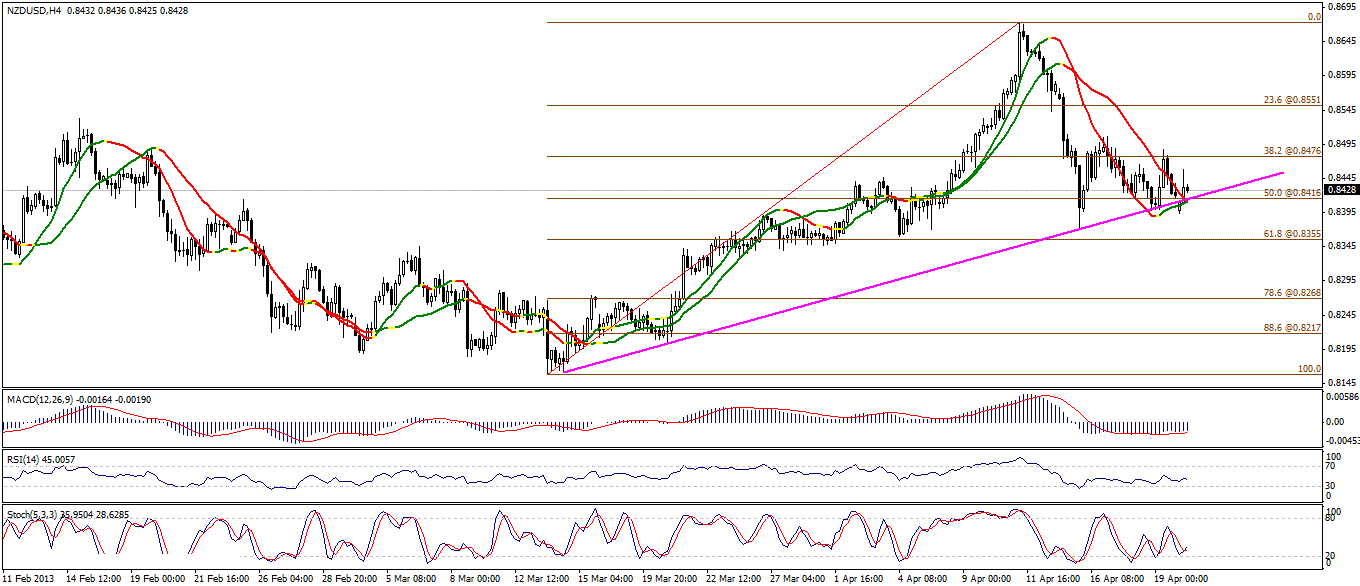 NZD/USD" title="NZD/USD" width="911" height="662">
NZD/USD's stability above 0.8415 is a positive catalyst, as it signals the completion of the bearish correction, and as a result, we believe we are ahead of a new bullish attempt during this week. Our outlook will remain valid as long as the pair holds above 0.8415--50% correction. Noting that if the pair breaks 0.8355 and resides below it, our expectations will be foiled.
- Trading range expected this week is between the key support at 0.8275 and the key resistance 0.8620.
- Short-term trend is upside targeting 0.8845 if 0.8130 remains intact.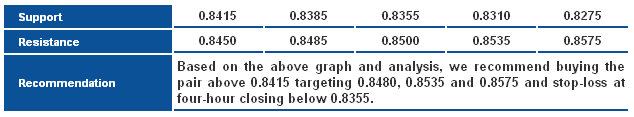 NZD/USD_S&R" title="NZD/USD_S&R" width="634" height="117">
GBP/JPY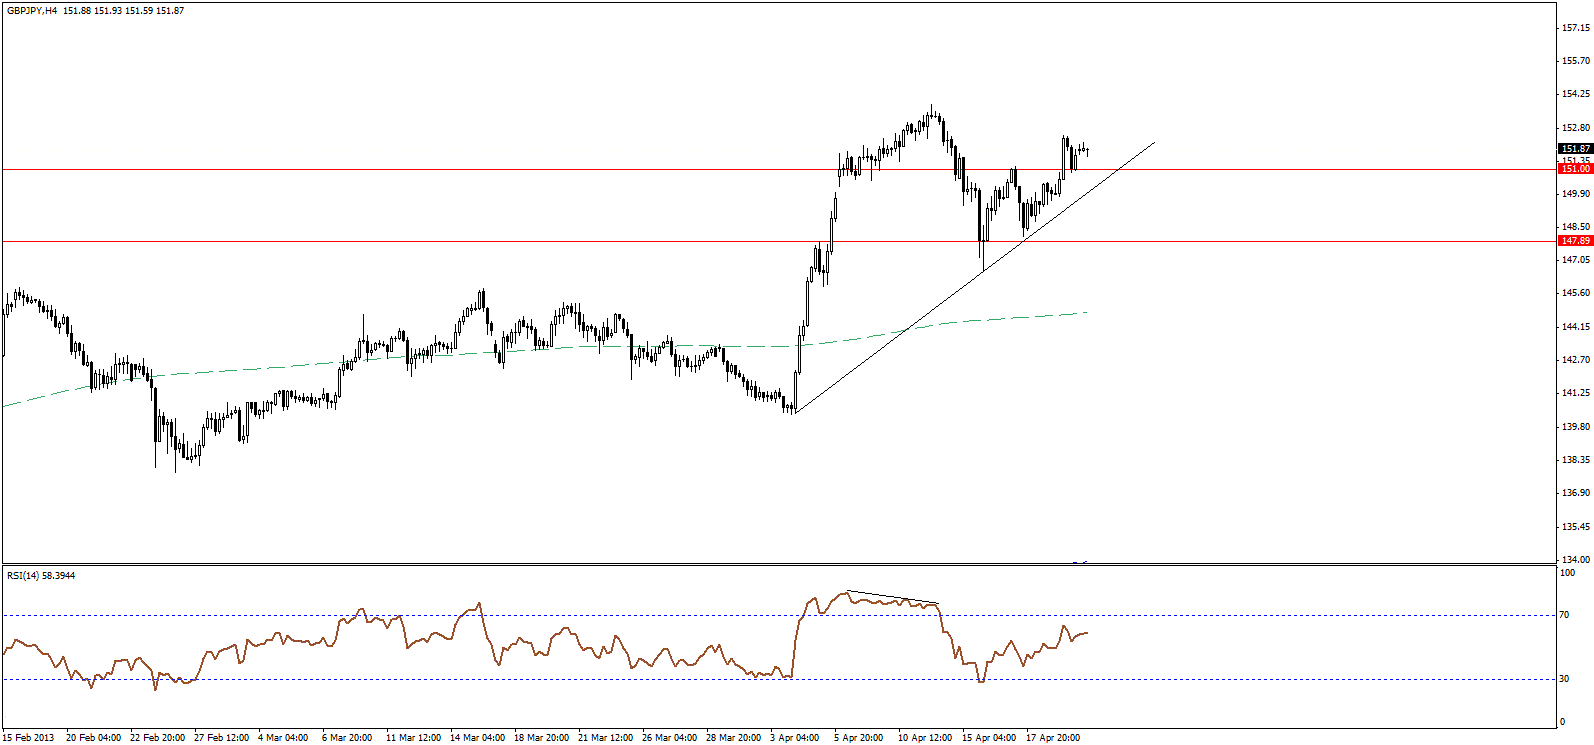 GBP/JPY" title="GBP/JPY" width="911" height="662">
The GBPJPY pair rebounded after testing 151.00 support level on Friday, where the short term structure remains slightly bullish, however with a risk of sideways trading. We will maintain our positive view so long as 151.00 horizontal support and the ascending trend line for the latest bullish wave are intact(shown on image), eying a retest of the recently recorded high near 154.00 level. In contrast, a break below the aformentioned technical support levels could lead to the bottom of the range-bound near 147.00.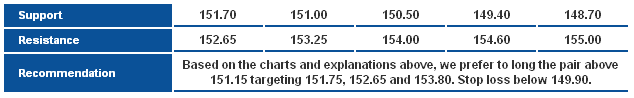 GBP/JPY_S&R" title="GBP/JPY_S&R" width="634" height="98">
EUR/JPY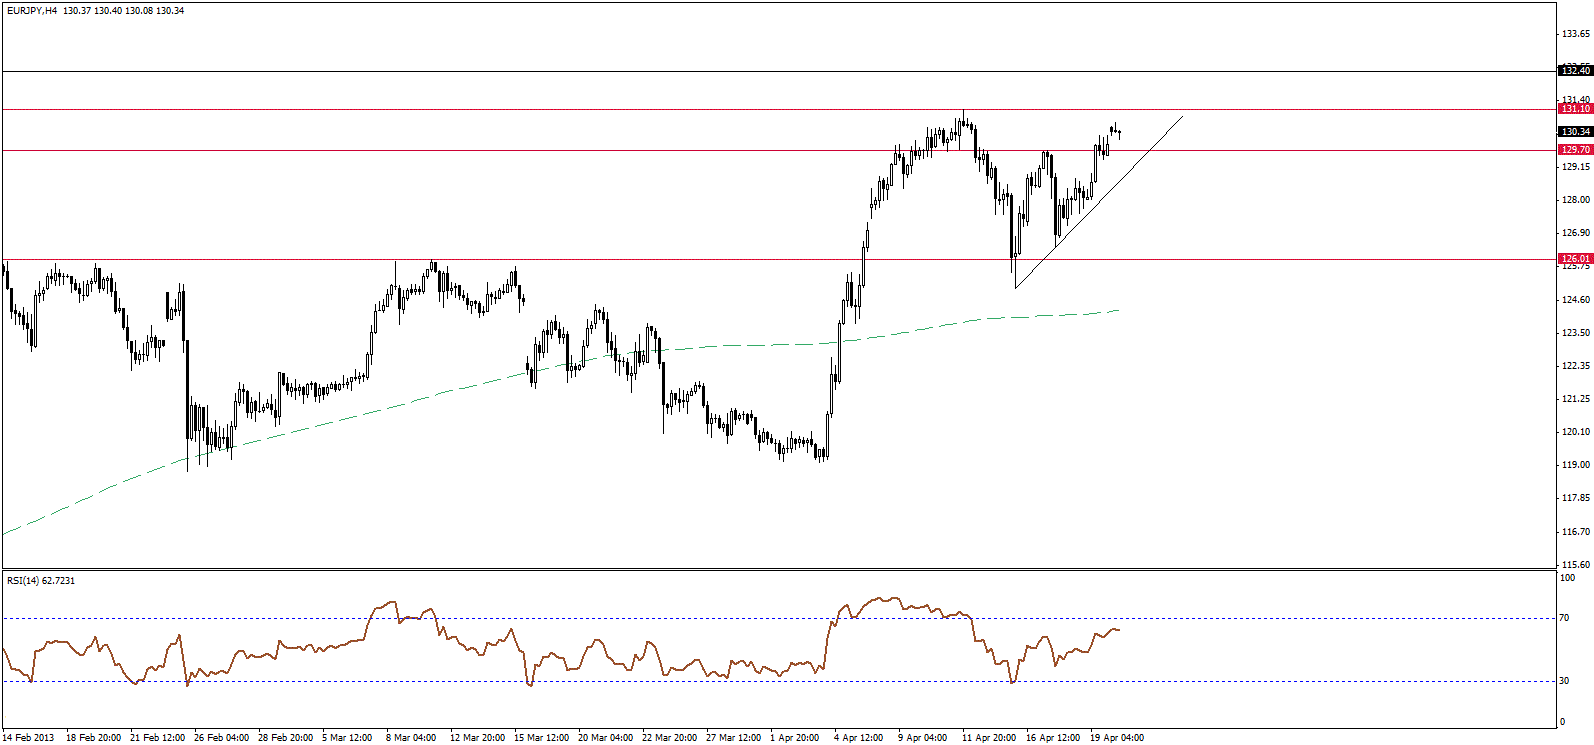 EUR/JPY" title="EUR/JPY" width="911" height="662">
The EURJPY pair starts the week with a bullish gap, currently settles just below the recent major high at 131.10, while above 129.50-129.70 support level. Holding above 129.50 area gives the bullish scenario further chances, and a retest of 131.10 seems imminent, accordingly, we have a positive bias towards the pair this week, so long as 129.50 is intact.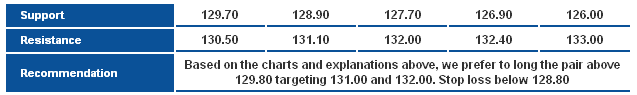 EUR/JPY_S&R" title="EUR/JPY_S&R" width="637" height="95">
EUR/GBP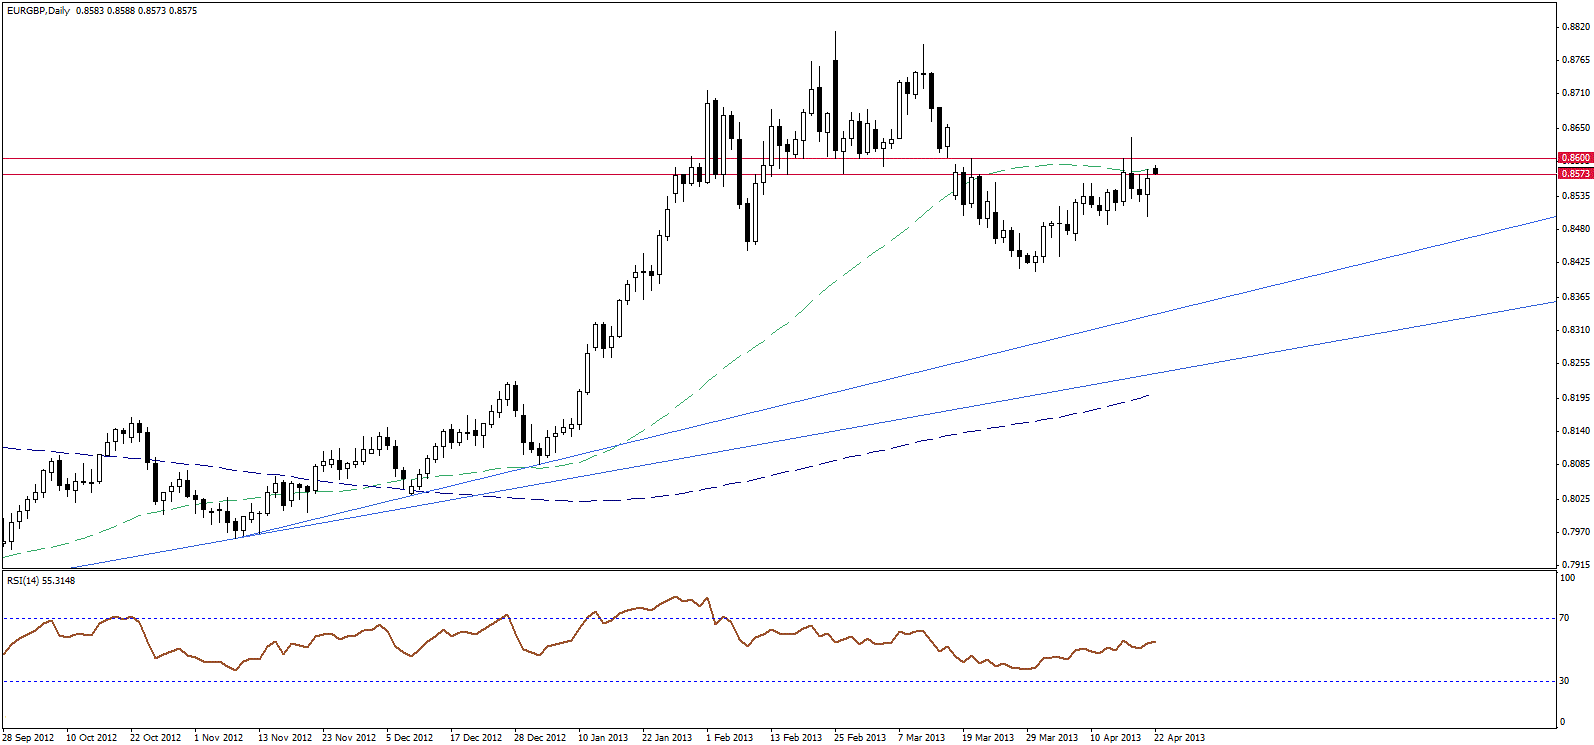 EUR/GBP" title="EUR/GBP" width="911" height="662">
The EURGBP pair is testing 0.8600 pivotal resistance again, if the price manages to hold well above this resistance, that could be the catalyst for further upside. However, we still expect the bearish resumption scenario to evolve from this area, accordingly, we maintain our bearish view.
- English (UK)
- English (India)
- English (Canada)
- English (Australia)
- English (South Africa)
- English (Philippines)
- English (Nigeria)
- Deutsch
- Español (España)
- Español (México)
- Français
- Italiano
- Nederlands
- Português (Portugal)
- Polski
- Português (Brasil)
- Русский
- Türkçe
- العربية
- Ελληνικά
- Svenska
- Suomi
- עברית
- 日本語
- 한국어
- 简体中文
- 繁體中文
- Bahasa Indonesia
- Bahasa Melayu
- ไทย
- Tiếng Việt
- हिंदी
Daily Major And Cross Currencies: EUR/USD New Attempt At Upside
Published 04/22/2013, 03:53 AM
Updated 07/09/2023, 06:31 AM
Daily Major And Cross Currencies: EUR/USD New Attempt At Upside
Latest comments
Loading next article…
Install Our App
Risk Disclosure: Trading in financial instruments and/or cryptocurrencies involves high risks including the risk of losing some, or all, of your investment amount, and may not be suitable for all investors. Prices of cryptocurrencies are extremely volatile and may be affected by external factors such as financial, regulatory or political events. Trading on margin increases the financial risks.
Before deciding to trade in financial instrument or cryptocurrencies you should be fully informed of the risks and costs associated with trading the financial markets, carefully consider your investment objectives, level of experience, and risk appetite, and seek professional advice where needed.
Fusion Media would like to remind you that the data contained in this website is not necessarily real-time nor accurate. The data and prices on the website are not necessarily provided by any market or exchange, but may be provided by market makers, and so prices may not be accurate and may differ from the actual price at any given market, meaning prices are indicative and not appropriate for trading purposes. Fusion Media and any provider of the data contained in this website will not accept liability for any loss or damage as a result of your trading, or your reliance on the information contained within this website.
It is prohibited to use, store, reproduce, display, modify, transmit or distribute the data contained in this website without the explicit prior written permission of Fusion Media and/or the data provider. All intellectual property rights are reserved by the providers and/or the exchange providing the data contained in this website.
Fusion Media may be compensated by the advertisers that appear on the website, based on your interaction with the advertisements or advertisers.
© 2007-2024 - Fusion Media Limited. All Rights Reserved.