
Market Snapshot:
BRENT DAILY: Bearish Channel holds true - Now targeting 100?
108.30 has been a key level we have been watching and it has been successfully defended by the bears to bring the bearish channel back into play.
What adds more weight to this bias is the noticeable bearish bar which finally rejected the 108.30 resistance confluence. Whilst we have already tested and respected the 106.70 support, I would view any gains towards the upper channel as s 'gift' and a better price to get short and increase your reward / Risk ratio.
As long as the bearish channel holds we should be seeing price decline to beneath the 103 swing low and to 100, where we will reassess price. 
GOLD: Ranging tightly as we await the next move
Gold is continuing to be very kind to my pivotal S/R levels. Monday's bias was to trade short as long as we traded within the bearish channel, and to look for bearish set-ups near resistance levels.
This was Monday's report: "We are just managing to trade beneath the 1290 resistance where we have met the pivotal S/R level and the upper channel of a declining channel. Should this level continue to hold then the preference is to keep to the short-side with any bearish setups around resistance areas".
Not much needs to be changed here, other than a couple of numbers...
A break above 1278 opens up 1290, 1300, 1310 and 1330. Also because we are at a confluence area, if the level does break there is a higher chance we may see a more bullish run.
However if we remain beneath the resistance confluence of 1278 and break below 1270 then 1260 is next in line. The key area to break for a larger bearish move is below 1250 as this opens up 1200 and 1180. 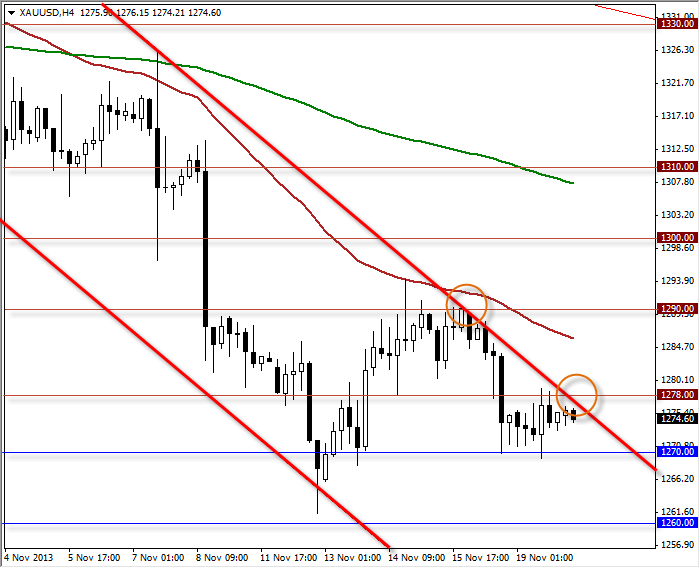
EUR/AUD: Enticing for Range Traders
Whilst we have been oscillating between the broad range of 1.405-1.457, yesterday's rejection of the 1.435 support confluence (Monthly Pivot and 50eMA) may signal the end of this oscillating behaviour, and the opportunity to trade back up to 1.4570 resistance - and who, know, perhaps jump on board the breakout too?
Whilst I am not one to anticipate a breakout it is the structural change and the respect of 1.435 support which is making me consider this view.
As long as we remain above 1.435 then bullish setups are preferred. 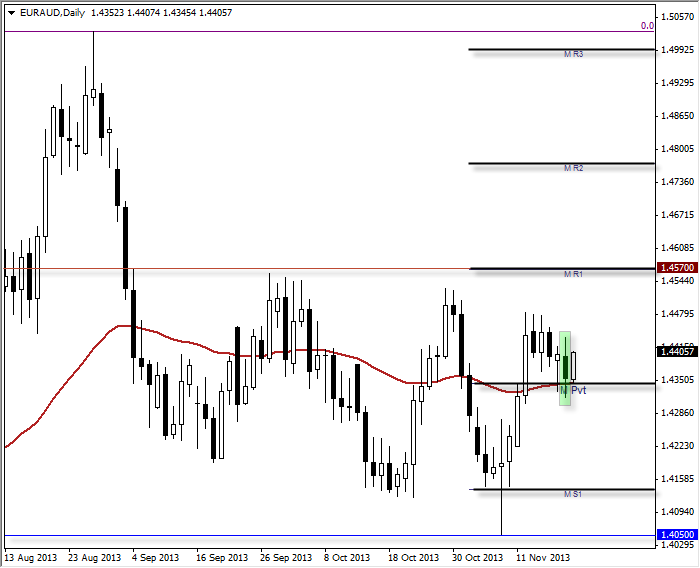 EUR/AUD" title="EUR/AUD" height="562" width="694">
USD/CHF: About to be catapulted?
I ask this because that is what the price structure reminds me of when I look at how price has retraced towards the broken trendline and support zone.
Whilst EUR/USD has broken above the trendline mentioned in yesterday's report I am still of the view price looks corrective (possibly a 'triple 3') which would then require a new bearish run.
Today I speak of USD/CHF simply because the levels now appear a little clearer.
If we see a bullish close today then this could be assumed to be a swing low to initiate long positions. Only a clear break beneath the support zone would make me reconsider this view. 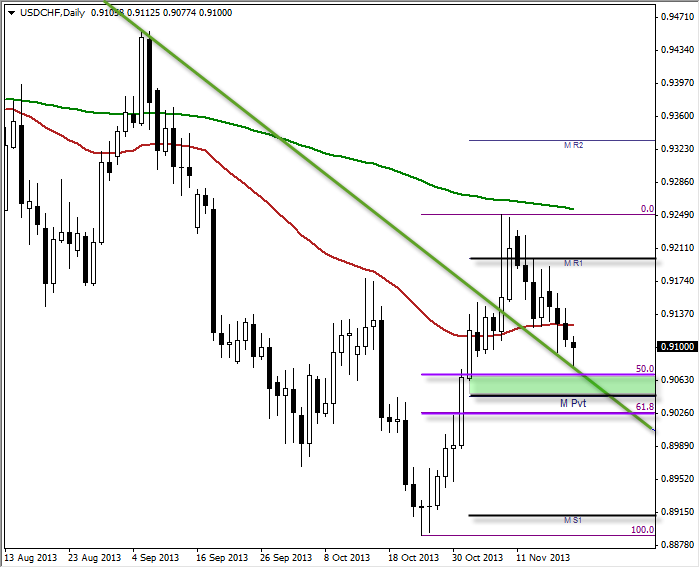 USD/CHF" border="0" height="568" width="700">
- English (UK)
- English (India)
- English (Canada)
- English (Australia)
- English (South Africa)
- English (Philippines)
- English (Nigeria)
- Deutsch
- Español (España)
- Español (México)
- Français
- Italiano
- Nederlands
- Português (Portugal)
- Polski
- Português (Brasil)
- Русский
- Türkçe
- العربية
- Ελληνικά
- Svenska
- Suomi
- עברית
- 日本語
- 한국어
- 简体中文
- 繁體中文
- Bahasa Indonesia
- Bahasa Melayu
- ไทย
- Tiếng Việt
- हिंदी
Daily Insight: Gold Ranging Tightly, Bearish Channel In Play For Brent
Published 11/20/2013, 03:58 AM
Updated 07/09/2023, 06:31 AM
Daily Insight: Gold Ranging Tightly, Bearish Channel In Play For Brent
Latest comments
Loading next article…
Install Our App
Risk Disclosure: Trading in financial instruments and/or cryptocurrencies involves high risks including the risk of losing some, or all, of your investment amount, and may not be suitable for all investors. Prices of cryptocurrencies are extremely volatile and may be affected by external factors such as financial, regulatory or political events. Trading on margin increases the financial risks.
Before deciding to trade in financial instrument or cryptocurrencies you should be fully informed of the risks and costs associated with trading the financial markets, carefully consider your investment objectives, level of experience, and risk appetite, and seek professional advice where needed.
Fusion Media would like to remind you that the data contained in this website is not necessarily real-time nor accurate. The data and prices on the website are not necessarily provided by any market or exchange, but may be provided by market makers, and so prices may not be accurate and may differ from the actual price at any given market, meaning prices are indicative and not appropriate for trading purposes. Fusion Media and any provider of the data contained in this website will not accept liability for any loss or damage as a result of your trading, or your reliance on the information contained within this website.
It is prohibited to use, store, reproduce, display, modify, transmit or distribute the data contained in this website without the explicit prior written permission of Fusion Media and/or the data provider. All intellectual property rights are reserved by the providers and/or the exchange providing the data contained in this website.
Fusion Media may be compensated by the advertisers that appear on the website, based on your interaction with the advertisements or advertisers.
© 2007-2024 - Fusion Media Limited. All Rights Reserved.