
AUD: The cash rate remained fixed at 2.5% with yesterday's RBS Statement providing little insight other than the AUD is still "uncomfortably high".
Today's GDP QoQ came in less than expected to see AUDUSD sell off and trading below last week's lows. 0.90 remains the next technical target.
EUR: Spanish unemployment came in better than expected at only -2.5k verses +49.3k expected, which helped EURUSD claw back some of the previous day’s losses and just below the highs.
GBP: Construction PMI also came in better than expected, rising at its fastest pace since 2007 to help to the depreciation of the USD yesterday. Later today we have Services PMI.
USD: ISM Manufacturing Index beat expectations for the 6th consecutive month and continues to trend up. The reading of 57.3 is the highest since March 2011. We have several 'Red News' release today including ADP Non-Farm employment change, Trade Balance, New Home sales and ISM Non-Manufacturing PMI.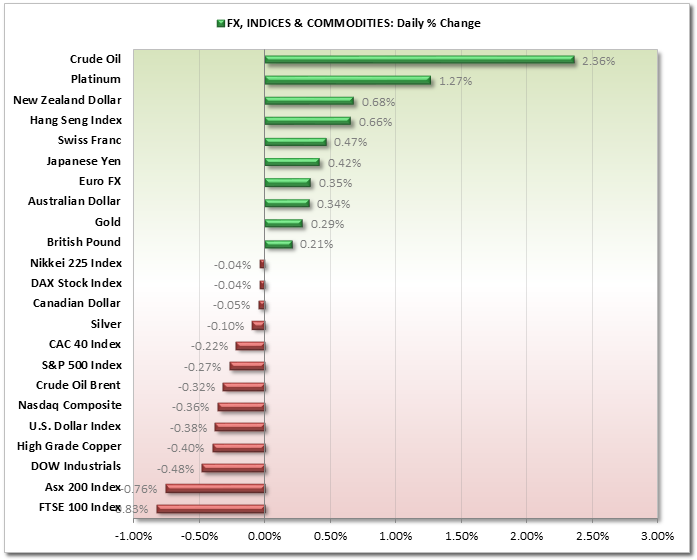
USD/JPY: Bearish Outside Day
My target for the past few days has been the swing highs of 103.70. All was going well as prices bounced merrily up the moving averages up until yesterday when we had closed the day with a 141 pip outside day, closing the day down.
As this is after a particularly nice trend it raises the possibility of this being a key reversal and to entice a decent retracement. It has been 15 trading days since the breakout from the daily triangle so this should not come as too much of a surprise, when you consider prior to the breakout we had not had such a lengthy directional move since May-June this year.
Looking at the intraday charts we can see how the decline form the 103.7 highs was abrupt, traded beneath the prior swing low, and is now retracing in a messy corrective-type fashion.
Additionally it broke the bullish trendline (one of my favourites..) and price appears to be creeping back towards it, which is conveniently near a confluence of resistance (comprising of Daily Pivot, 102.82 Pivotal S/R and 61.80% retracement).
Therefor my bias is for a 102.80 to hold and for price then target 102.00 support zone for an A-B-C style correction to the bullish trend.
We have lots of red news in US later so this may provide the spark required to get us moving along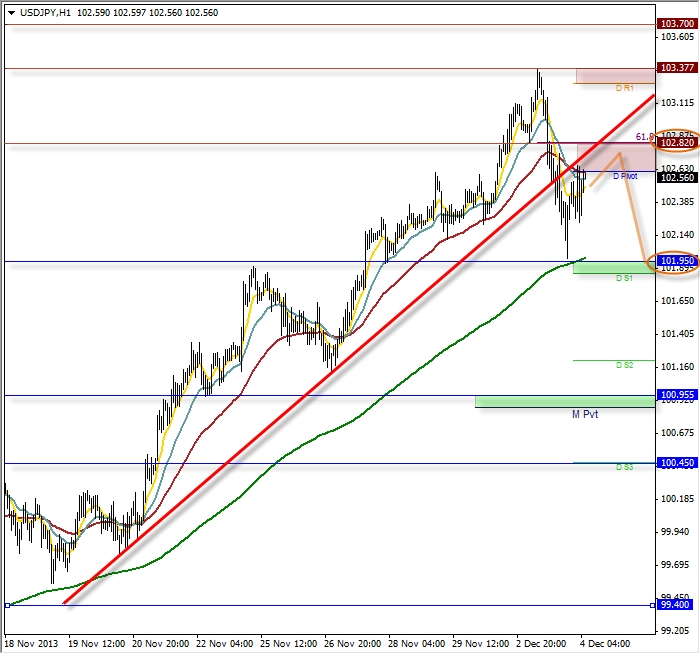 USD/JPY" width="700" height="654">
GBP/USD: Inside Day with 2nd consecutive Shooting Star Reversal
This is a slight modification to yesterday's analysis - whilst we did not see a break beneath the Shooting Star Reversal low, we did trade within the range of the candle and produce a subsequent Shooting Star Reversal.
This does highlight the hesitancy up at the 5yr highs and the longer this persists, the more chance we have of a retracement to the bullish trend..
Whilst I do see potential for Cable to trade higher, I also see the potential for a bearish retracement first (which is a similar scenario we are seeing with GBP/JPY at the moment).
The intraday charts more clearly display the higher low we produced yesterday, along with a bullish channel which we are now trading along the centre band. Whilst the Bullish Channel would usually entice extra buying, the lower high is a warning signal that we may be position ourselves for an dip lower.
In the event we do break above the 1.645 resistance zone, next target is 1.65, whilst then the next likely stalling point for a retracement is around 1.6300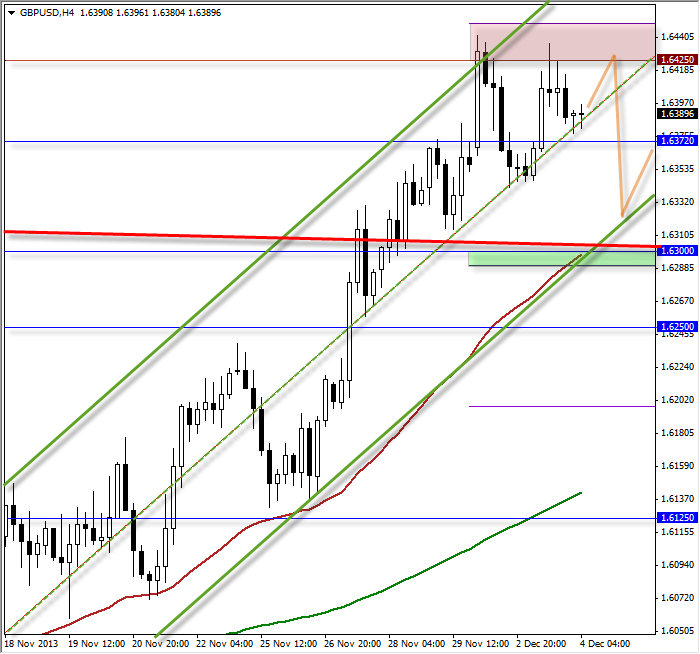 GBP/USD H4" width="700" height="654">
- English (UK)
- English (India)
- English (Canada)
- English (Australia)
- English (South Africa)
- English (Philippines)
- English (Nigeria)
- Deutsch
- Español (España)
- Español (México)
- Français
- Italiano
- Nederlands
- Português (Portugal)
- Polski
- Português (Brasil)
- Русский
- Türkçe
- العربية
- Ελληνικά
- Svenska
- Suomi
- עברית
- 日本語
- 한국어
- 简体中文
- 繁體中文
- Bahasa Indonesia
- Bahasa Melayu
- ไทย
- Tiếng Việt
- हिंदी
Daily FX Insight
Market Snapshot
3rd party Ad. Not an offer or recommendation by Investing.com. See disclosure here or
remove ads
.
Latest comments
Install Our App
Risk Disclosure: Trading in financial instruments and/or cryptocurrencies involves high risks including the risk of losing some, or all, of your investment amount, and may not be suitable for all investors. Prices of cryptocurrencies are extremely volatile and may be affected by external factors such as financial, regulatory or political events. Trading on margin increases the financial risks.
Before deciding to trade in financial instrument or cryptocurrencies you should be fully informed of the risks and costs associated with trading the financial markets, carefully consider your investment objectives, level of experience, and risk appetite, and seek professional advice where needed.
Fusion Media would like to remind you that the data contained in this website is not necessarily real-time nor accurate. The data and prices on the website are not necessarily provided by any market or exchange, but may be provided by market makers, and so prices may not be accurate and may differ from the actual price at any given market, meaning prices are indicative and not appropriate for trading purposes. Fusion Media and any provider of the data contained in this website will not accept liability for any loss or damage as a result of your trading, or your reliance on the information contained within this website.
It is prohibited to use, store, reproduce, display, modify, transmit or distribute the data contained in this website without the explicit prior written permission of Fusion Media and/or the data provider. All intellectual property rights are reserved by the providers and/or the exchange providing the data contained in this website.
Fusion Media may be compensated by the advertisers that appear on the website, based on your interaction with the advertisements or advertisers.
© 2007-2024 - Fusion Media Limited. All Rights Reserved.