
EUR/USD recently reached the target level 1.3013 that was given in the following trade opportunity alert that I received for this currency pair last week. The pair fell sharply down the next day after we covered this alert – nearly touching 1.3013 with the Doji Japanese Candlestick pattern on the daily charts. The pair then corrected shortly up and fell through this target level the last Friday.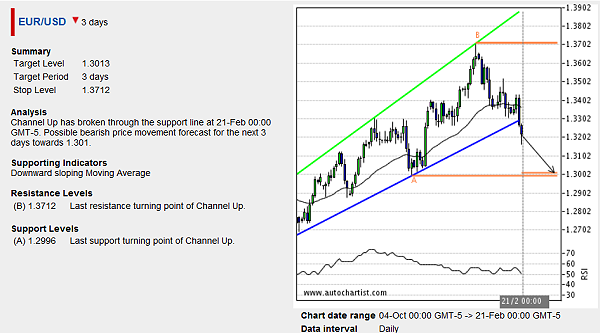 EUR/USD" title="EUR/USD" width="600" height="333">
Last Friday, GBP/USD also reached the target level 1.5080 that was given in the following trade opportunity alert. This target level corresponds to the last upward reversal point (A) of the Flag chart pattern identified by Autochartist on the 4-hour GBP/USD charts. This downward breakout continues the previous sharp downward price impulse which recently broke the long-term round support level 1.5300 (which had reversed the pair up a few times from 2010). GBP/USD is likely to continue downward movement in the coming sessions.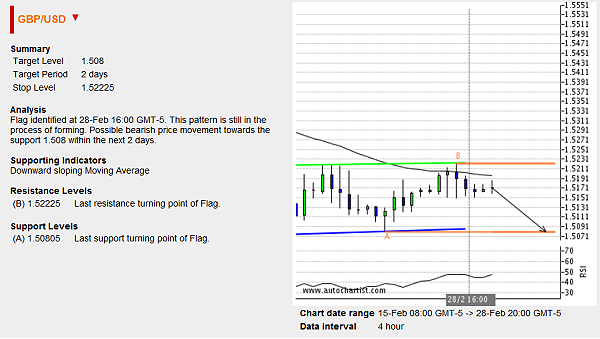 GBP/USD" title="GBP/USD" width="600" height="339">
The following weekly GBP/USD chart shows the previous price action near the major support 1.5300: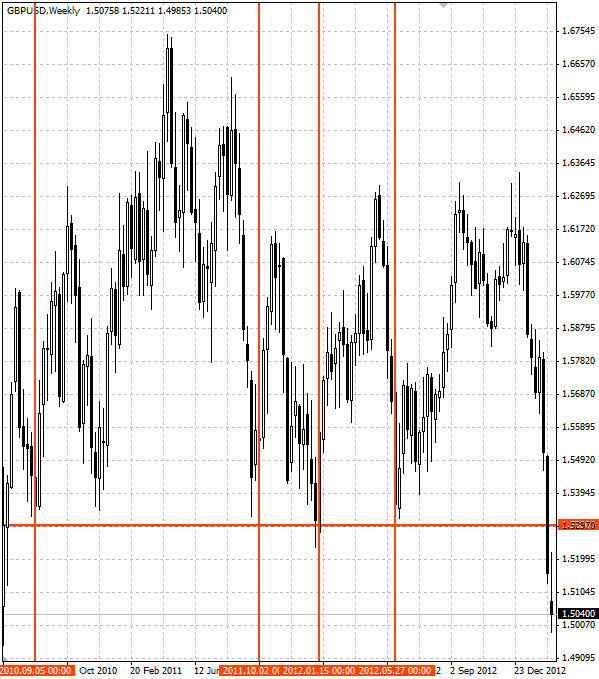 GBP/USD Weekly" title="GBP/USD Weekly" width="599" height="679">
- English (UK)
- English (India)
- English (Canada)
- English (Australia)
- English (South Africa)
- English (Philippines)
- English (Nigeria)
- Deutsch
- Español (España)
- Español (México)
- Français
- Italiano
- Nederlands
- Português (Portugal)
- Polski
- Português (Brasil)
- Русский
- Türkçe
- العربية
- Ελληνικά
- Svenska
- Suomi
- עברית
- 日本語
- 한국어
- 简体中文
- 繁體中文
- Bahasa Indonesia
- Bahasa Melayu
- ไทย
- Tiếng Việt
- हिंदी
Daily Forex Update: EUR/USD & GBP/USD
Published 03/04/2013, 04:03 AM
Updated 03/09/2019, 08:30 AM
Daily Forex Update: EUR/USD & GBP/USD
Latest comments
Loading next article…
Install Our App
Risk Disclosure: Trading in financial instruments and/or cryptocurrencies involves high risks including the risk of losing some, or all, of your investment amount, and may not be suitable for all investors. Prices of cryptocurrencies are extremely volatile and may be affected by external factors such as financial, regulatory or political events. Trading on margin increases the financial risks.
Before deciding to trade in financial instrument or cryptocurrencies you should be fully informed of the risks and costs associated with trading the financial markets, carefully consider your investment objectives, level of experience, and risk appetite, and seek professional advice where needed.
Fusion Media would like to remind you that the data contained in this website is not necessarily real-time nor accurate. The data and prices on the website are not necessarily provided by any market or exchange, but may be provided by market makers, and so prices may not be accurate and may differ from the actual price at any given market, meaning prices are indicative and not appropriate for trading purposes. Fusion Media and any provider of the data contained in this website will not accept liability for any loss or damage as a result of your trading, or your reliance on the information contained within this website.
It is prohibited to use, store, reproduce, display, modify, transmit or distribute the data contained in this website without the explicit prior written permission of Fusion Media and/or the data provider. All intellectual property rights are reserved by the providers and/or the exchange providing the data contained in this website.
Fusion Media may be compensated by the advertisers that appear on the website, based on your interaction with the advertisements or advertisers.
© 2007-2024 - Fusion Media Limited. All Rights Reserved.