
EM fears have come back to dominate the market again. The crisis in Ukraine continues, with the situation made worse yesterday after Russia’s President Vladimir Putin ordered a surprise military exercises of ground and air forces near Ukraine. Russia’s assertions that the drill has nothing to do with the situation in the Ukraine did not convince many people. The situation discouraged investors about Europe and encouraged a flight-to safety into USD, something that was also seen by the decline in all European stock markets while the S&P 500 hit a record high during the day (although it closed off the highs). The problems in the Ukraine added to those in Turkey, where a purported recording of PM Erdogan supposedly discussing how to conceal illicit funds has roiled the markets. Furthermore, South African Finance Minister Gordhan and Reserve Bank Governor Marcus both called the rand a “shock absorber” and spoke enthusiastically about how the weaker currency improved the country’s competitiveness, which had the predictable impact on the currency (ZAR weakened by about 1% vs USD). Overall the dollar gained against almost all the EM currencies that we track. I would expect these gains to continue for a few days at least as the situation in Ukraine seems to be quite volatile. However I don’t expect a major collapse by any means. Note that EM stocks actually rose yesterday and today, indicating that investors are not fleeing the asset class as a whole by any means.
The dollar also gained against all its G10 counterparts. It was notable that the flight to safety did not include the yen or Swiss franc, which usually rise under such circumstances. CHF has only limited room to appreciate against USD when USD is appreciating against EUR, because that would mean CHF appreciating against EUR, but the Swiss National Bank is actively intervening to prevent EUR/CHF from approaching its 1.20 floor. On the other hand, USD/JPY was stable on reports that some Japanese manufacturers are going to pay higher bonuses this year, which might increase inflation. I could see USD/JPY moving lower as the EM tensions increase. AUD was the biggest loser overnight after private capital expenditure in Q4 came in at -5.2% qoq, far below market estimates of -1.3% qoq and the worst in four years. My view remains that AUD is headed lower.
Sentiment towards USD was also boosted by much better than expected new home sales for January. However that didn’t prevent bond yields from declining and the implied interest rate on 2016 Fed Funds futures from falling some 4 bps, which shows the housing data didn’t convince anyone that the economy was improving faster than they had thought.
The main event of the day will be the rescheduled testimony of Federal Reserve Chair Janet Yellen before the Senate Banking Committee. We do not expect much of a reaction to her comments, since it is expected to repeat what she said before the House Financial Services Committee. However there could be a knee-jerk reaction to buy dollars as she reiterates her intention to press on with tapering off the Fed’s bond purchase.

As for the indicators, we get the preliminary German CPI for February, ahead of Friday’s Eurozone CPI data. Germany’s inflation is forecast to have slowed to +1.1% yoy from +1.2% in January. That could give rise to speculation that the ECB might ease at next week’s meeting and could be EUR-negative, although I don’t expect them to change policy. From Germany we also have the unemployment rate for the same month, which is expected to have remained at 6.8%. From Eurozone as a whole, the M3 annual growth is expected to have accelerated to +1.1% yoy in January from +1.0% yoy in December. Nonetheless, the 3-month moving average is forecast to have slowed to +1.2% from +1.3%. Attention will also focus on lending, which continues to contract. Private sector credit has shrunk yoy for 21 consecutive months and recently has started to accelerate; it was down 2.4% yoy in December, compared with -1.6% yoy in November. Eurozone’s final consumer confidence for February is also coming out.

In US, durable goods orders for January are due out. Both the headline and the excluding transportation figures are expected to have fallen but at a slower pace than in December, which could be encouraging. We also get the initial jobless claims for the week ended on Feb 22.
Canada’s current account deficit for Q4 is expected to have widened to CAD 17.0bn from CAD 15.5bn.
Besides Yellen’s testimony, there are a large number of ECB members and other officials speaking at a Bundesbank Symposium on Financial Stability and the Role of Central Banks, including ECB President Draghi and Dallas Federal President Richard Fisher. ECB Governing Council member Erkki Liikanen speaks on the balance between markets and regulation. Finally, Atlanta Fed President Dennis Lockhart and Kansas City Fed President Esther George will speak together at the Atlanta Fed's 2014 Banking Outlook Conference.
The Market EUR/USD
 EUR/USD Hourly Chart" title="EUR/USD Hourly Chart" width="474" height="242">
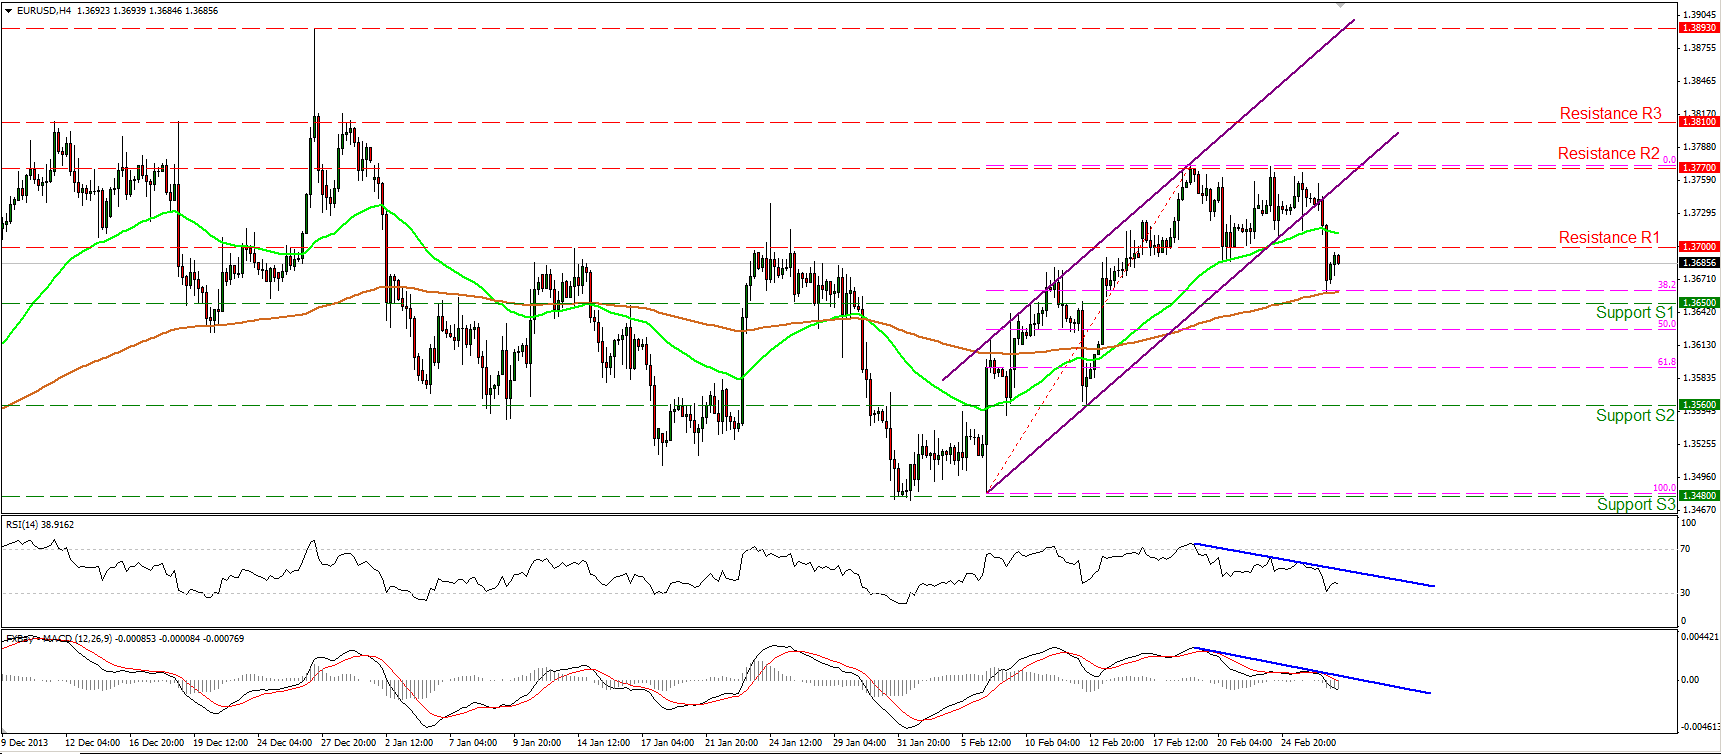
The EUR/USD fell sharply on Wednesday, violating the 1.3700 barrier. The decline was halted by the 200-period moving average and the 38.2% Fibonacci retracement level of the 6th – 19th February advance, slightly above the support of 1.3650 (S1). A clear dip below that strong support zone would have larger bearish implications and may pave the way towards the 1.3560 (S2) hurdle. Both the RSI and the MACD are following downward paths, while the MACD also lies below both its trigger and zero lines, confirming the recent negative momentum of the currency pair.
• Support: 1.3650 (S1), 1.3560 (S2), 1.3480 (S3).
• Resistance: 1.3700(R1), 1.3770 (R2), 1.3810 (R3).
 EUR/JPY Hourly Chart" title="EUR/JPY Hourly Chart" width="474" height="242">
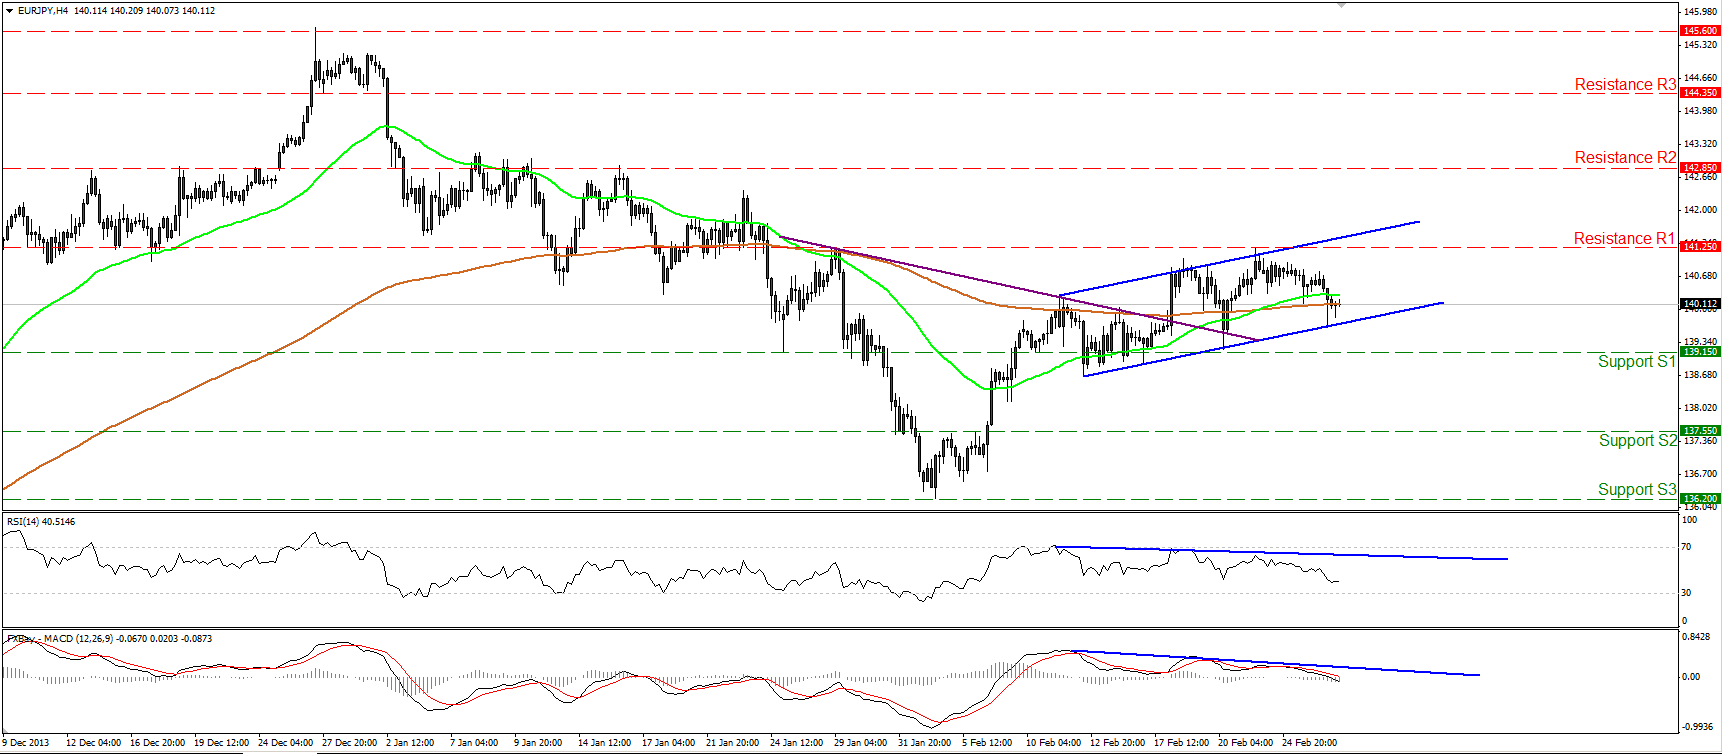
The EUR/JPY moved slightly lower, remaining between the key resistance of 141.25 (R1) and the support of 139.15 (S1). I consider the short-term outlook to be neutral at the moment, since only a break above the 141.25 (R1) resistance would confirm that the decline that started from the 27th of December has bottomed. The negative divergence between our momentum studies and the price action remains in effect and a clear dip below the 139.15 (S1) support will flip the bias back to the downside.
• Support: 139.15 (S1), 137.55 (S2), 136.20 (S3)
• Resistance: 141.25 (R1), 142.85 (R2), 144.35 (R3).
 GBP/USD Hourly Chart" title="GBP/USD Hourly Chart" width="474" height="242">
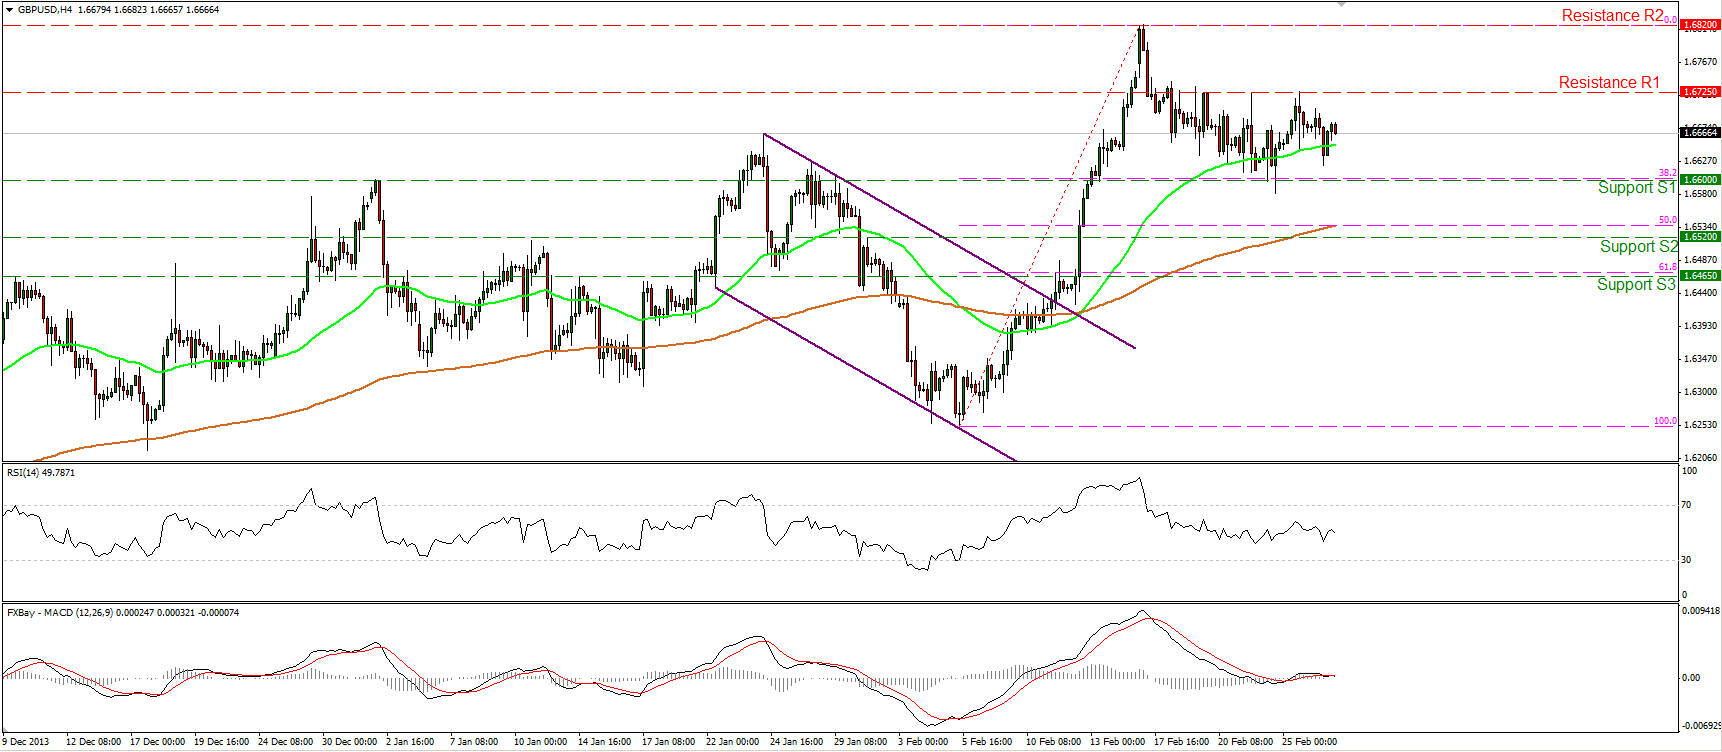
The GBP/USD once again hit the resistance at 1.6725 (R1) and moved lower to settle near the levels we left it. The intraday bias remains neutral for now, since above 1.6725 (R1) may target once again the 1.6820 (R2) high, while a dip below the 38.2% retracement level of the 5th -17th Feb. rally, at 1.6600 (S1), may extend the correcting wave. Both momentum studies lie near their neutral levels, confirming the non-trending phase of cable. On the daily chart, the longer-term uptrend has resumed after overcoming January’s highs.
• Support: 1.6600 (S1), 1.6520 (S2), 1.6465 (S3).
• Resistance: 1.6725 (R1), 1.6820 (R2), 1.6885 (R3).
Gold

Gold met resistance at 1345 (R1) and fell below the blue support line to find support at the 50-period moving average. Considering negative divergence between our oscillators and the price action, I would expect the precious metal to extend the corrective wave. On the daily chart Tuesday’s and Wednesday’s candles formed a bearish engulfing pattern, enhancing the probabilities for further retracement.
• Support: 1310 (S1), 1290 (S2), 1270 (S3).
• Resistance: 1345 (R1), 1360 (R2), 1376 (R3)
Oil

WTI moved slightly higher, remaining below the 103.25 (R1) resistance level. A clear upward violation of that barrier would signal the continuation of the uptrend and may pave the way towards the next hurdle at 104.35 (R2). As long as the oil is trading above the blue support line, I consider the short-term upward path to be intact. Only a clear fall below the support level of 100.75 (S1) would be a reason to reconsider our analysis.
• Support: 100.75 (S1), 98.85 (S2), 96.50 (S3).
• Resistance: 103.25 (R1), 104.35 (R2), 108.15 (R3).
BENCHMARK CURRENCY RATES - DAILY GAINERS AND LOSERS

MARKETS SUMMARY

Disclaimer: This information is not considered as investment advice or investment recommendation but instead a marketing communication. This material has not been prepared in accordance with legal requirements designed to promote the independence of investment research, and that it is not subject to any prohibition on dealing ahead of the dissemination of investment research. IronFX may act as principal (i.e. the counterparty) when executing clients’ orders. This material is just the personal opinion of the author(s) and client’s investment objective and risks tolerance have not been considered.
IronFX is not responsible for any loss arising from any information herein contained. Past performance does not guarantee or predict any future performance. Redistribution of this material is strictly prohibited. Risk Warning: Forex and CFDs are leveraged products and involves a high level of risk. It is possible to lose all your capital. These products may not be suitable for everyone and you should ensure that you understand the risks involved. Seek independent advice if necessary. IronFx Financial Services Limited is authorised and regulated by CySEC (Licence no. 125/10). IronFX UK Limited is authorised and regulated by FCA (Registration no. 585561). IronFX (Australia) Pty Ltd is authorized and regulated by ASIC (AFSL no. 417482)