
USD is opening mixed in Europe, with some profit-taking in the safe-haven JPY and CHF, which were so strong yesterday. On the other hand the AUD and NZD rallied strongly overnight. Both these moves are consistent with some calm returning to the market and a recovery in risk appetite. This was also evident in the rebound in US stocks during the day (although ultimately they closed lower) and slightly higher US Treasury yields.
Some familiar themes are coming back. GBP recovered along with the high-beta currencies. Its day of volatility following Bank of England Gov. Carney’s speech last Friday is fading fast and the strong-GBP theme is returning. Similarly, CAD was the biggest loser in the G10 overnight even though Finance Minister Flaherty said there was no government push to drive the currency down. He said the market sets the rate; if so, the market appears to be setting it lower.
Most EM currencies were weaker again today in with the conspicuous exception of MXN, which gained after the trade surplus for December came in at double market estimates. That only demonstrates again the importance that the market places on EM countries being able to finance themselves. KRW also rebounded.
Today the focus of attention will be on the late-night meeting of the Turkish central bank tonight. The central bank said it will “take the necessary policy measures for price stability” at an extraordinary meeting this evening. Speculation is that it could do anything from raising interest rates massively (3 percentage points has been mentioned) to imposing capital controls. Together with the South African Reserve Bank (SARB) meeting tomorrow, these two have the potential to stabilize the EM crisis and reverse some of the sharp movement we’ve seen in the FX markets recently. Then again, they also have the potential to disappoint. The commodity currencies would be an obvious G10 beneficiary, but optimistic investors might also want to consider buying NOK as well if they expect a rebound in EM. NOK has been the currency most closely correlated with TRY and ZAR over the last year. The correlation between TRY and the commodity currencies isn’t much different than that with TRY and EUR, which implies that a recovery in TRY today could help EUR/USD as well.

As for the indicators, the European day starts with France’s consumer confidence for January which is expected to remain unchanged. Sweden takes its turn with its PPI, its retail sales and its trade data, all for December. The country’s PPI is estimated to have risen at the same pace as in November, while growth in retail sales is forecast to have slowed. Last month the figure exceeded estimates and SEK reacted strongly, rising approximately 120 pips, thus a slowdown may be SEK-negative.
In the UK, the nation’s preliminary GDP for Q4 is estimated to have risen 0.7% on a quarterly basis, a slowdown from +0.8% qoq in Q3. Nonetheless, the yoy rate is forecast to be up to +2.8% from +1.9%. The pound has been gaining on expectations of strong growth and a number like this could be expected to maintain the momentum in the currency.

From US, we get the durable goods orders for December. Both the headline and the figure excluding transportation equipment are forecast to rise, but at a slower pace than in November. The S&P/Case-Shiller home price index for November is forecast to have risen a bit faster than in October. The Conference Board consumer confidence for January is forecast to fall slightly while the Richmond Fed manufacturing activity is estimated to remain unchanged. Net net, the figures as forecast would probably not give any new direction to trading, so we will be waiting to see any deviations from the forecasts.
We have only one speaker on the schedule on Tuesday. BoE Governor Mark Carney delivers a speech at an event in Scotland. He’s unlikely to say anything different than he said Friday in Davos, but he may comment on the market reaction to his Friday speech.
The Market
 EUR/USD" title="EUR/USD" align="bottom" border="0" height="242" width="474">
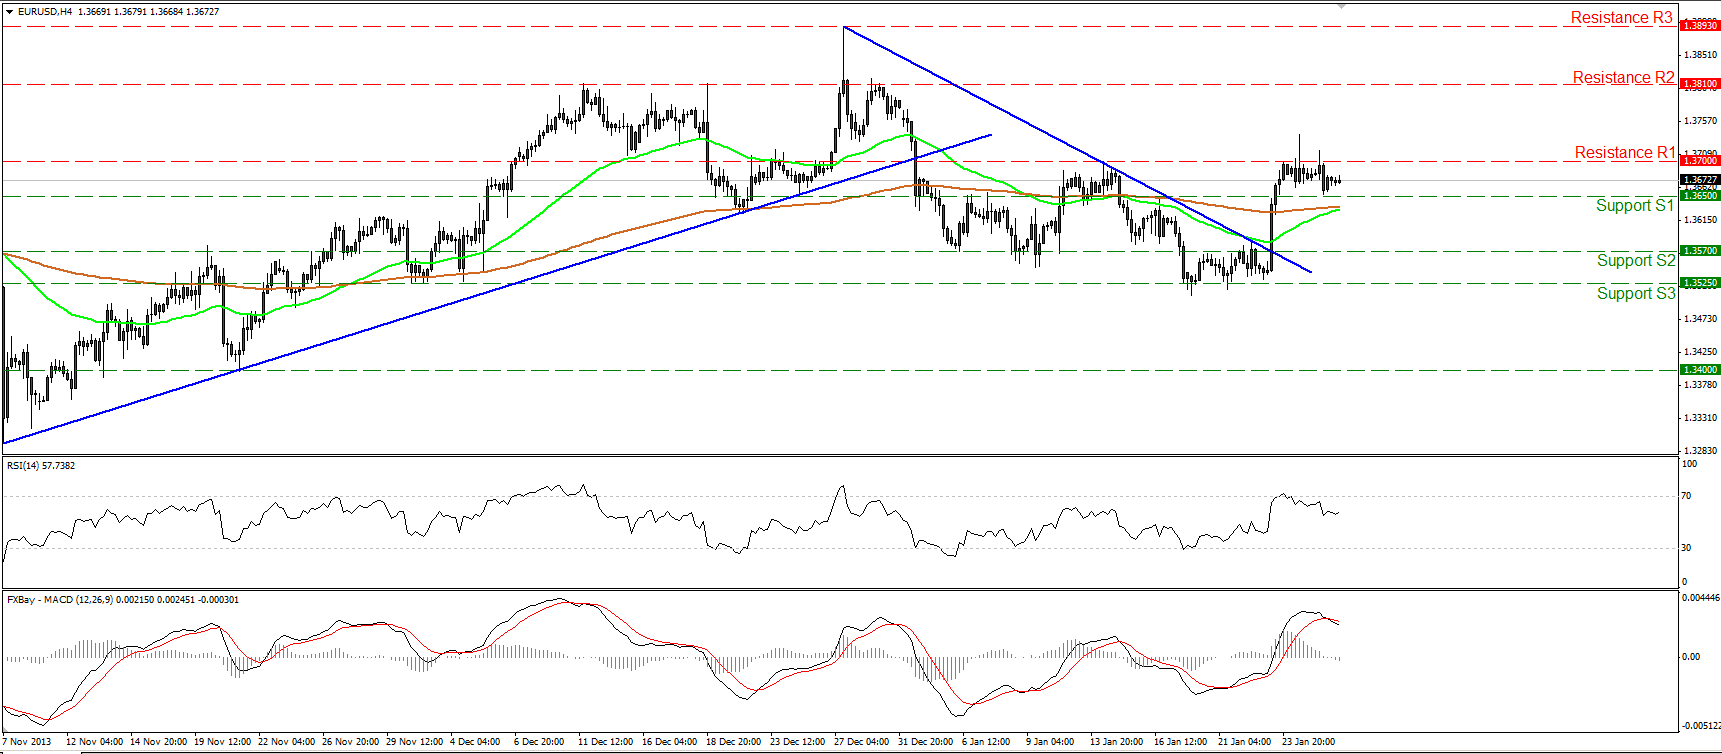
• EUR/USD failed once again to maintain above the 1.3700 (R1) resistance after the better-than-expected German Ifo indices. Both momentum studies moved lower, while the MACD, although in a bullish territory, crossed below its signal line, confirming the weakness of the longs to overcome the 1.3700 (R1) hurdle, for now. On the daily chart, we can identify a shooting star and a clear dip below 1.3650 (S1) may confirm the candlestick pattern and we might experience extensions towards the support area between 1.3525 (S3) and 1.3570 (S2). On the other hand, a successful break above 1.3700 (R1) may open the way towards 1.3810 (R2).
• Support: 1.3650 (S1), 1.3570 (S2), 1.3525 (S3).
• Resistance: 1.3700 (R1), 1.3810 (R2), 1.3893 (R3).
 EUR/JPY" title="EUR/JPY" align="bottom" border="0" height="242" width="474">
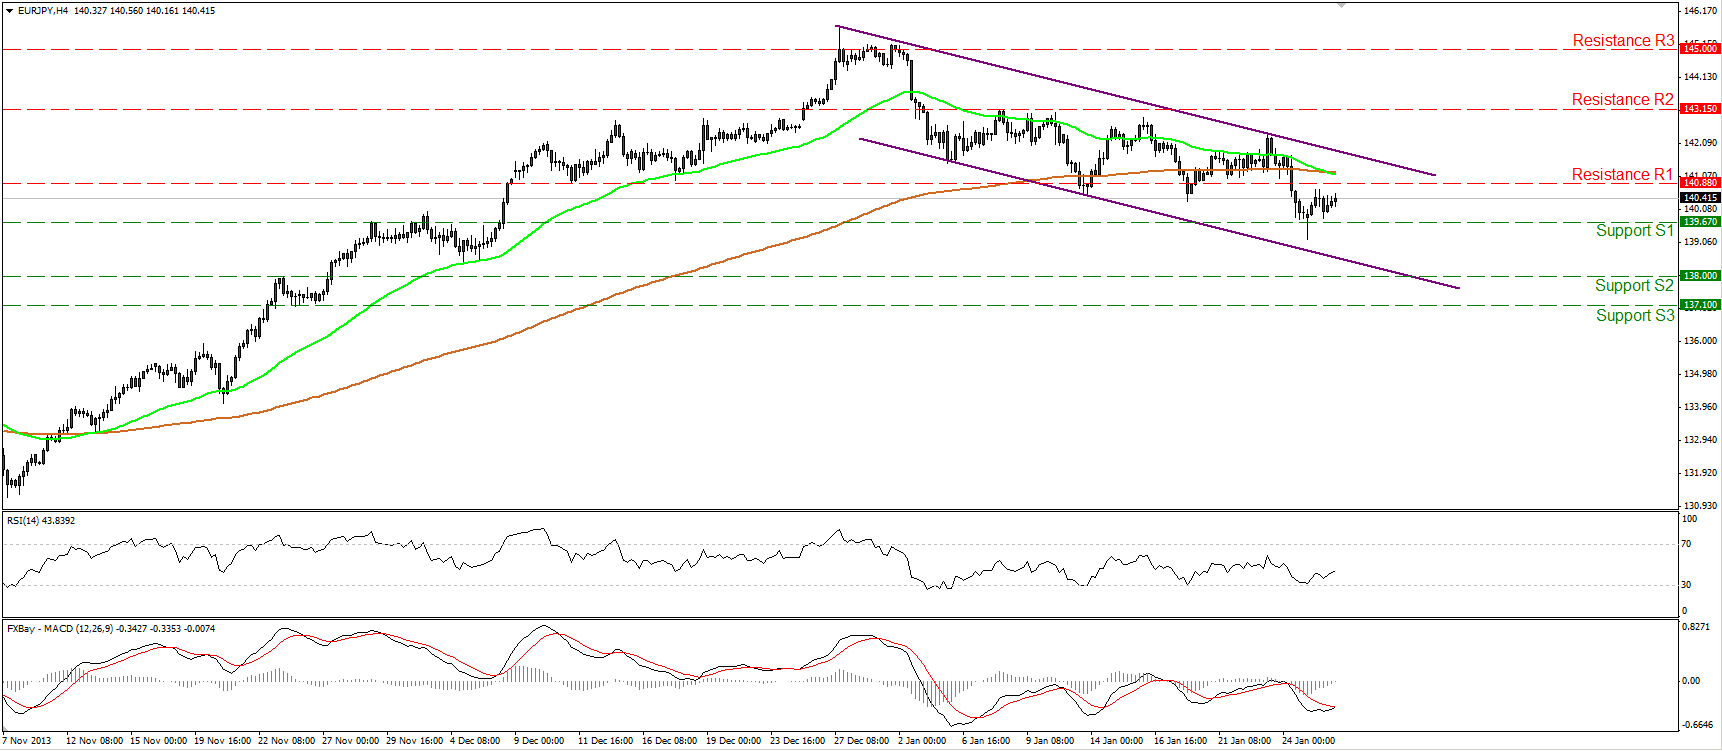
• EUR/JPY consolidates between the support of 139.67 (S1) and the resistance of 140.88 (R1). A clear violation below the 139.67 (S1) barrier may trigger extensions towards the next hurdle at 138.00 (S2). The 50-period moving average crossed below the 200-period moving average and since the latter is trading within the purple downward sloping channel, the short-term outlook remains to the downside. The RSI found support near its 30 level, while the MACD oscillator, although in its negative area, seems ready to cross above its trigger, thus we may experience a corrective advance before the bears prevail again. On the daily and weekly charts, the longer-term uptrend is still in progress and I would consider the short-term decline as a retracement of the major upward path, at the moment.
• Support: 139.67 (S1), 138.00 (S2), 137.10 (S3).
• Resistance: 140.88 (R1), 143.15 (R2), 145.00 (R3).
 GBP/USD" title="GBP/USD" align="bottom" border="0" height="242" width="474">
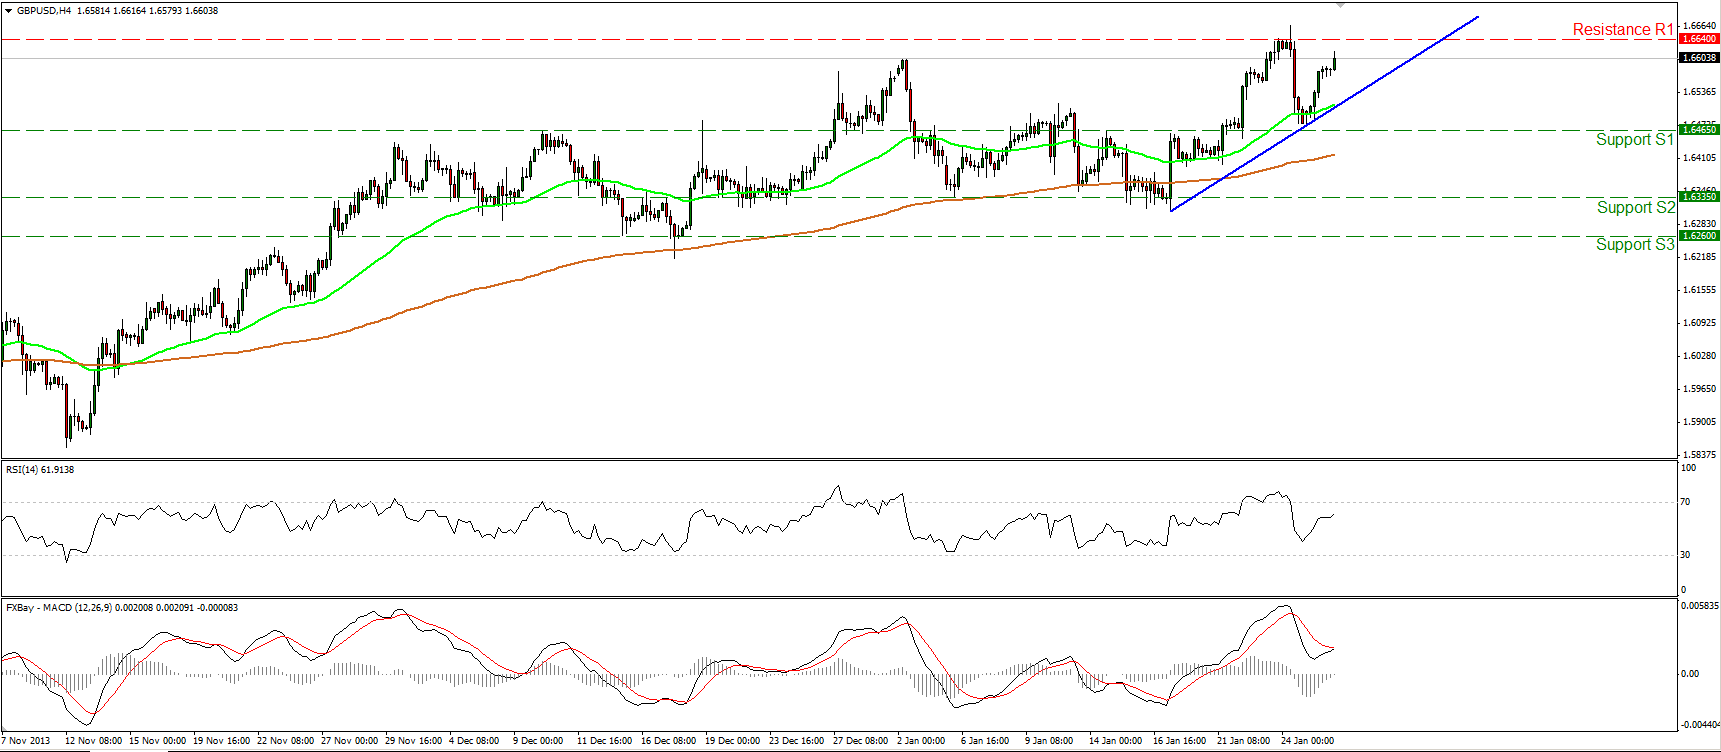
• GBP/USD moved higher on Monday, after finding support slightly above the 1.6465 (S1) barrier. The pair is now heading towards the resistance of 1.6640 (R1), the violation of which may open the way towards the obstacle of 1.6735 (R2). The MACD oscillator, already in a bullish territory, seems ready to cross above its trigger line, confirming the recent positive momentum. As long as the rate is trading above both the moving averages and the blue short-term support line, I see a positive picture.
• Support: 1.6465 (S1), 1.6335 (S2), 1.6260 (S3).
• Resistance: 1.6640 (R1), 1.6735 (R2), 1.6885 (R3).
Gold

• Gold moved lower on Monday and is once again below the resistance of 1268 (R1). The metal is now testing the area near the longer-term trend line, the 50-period moving average and the support at 1257 (S1). A rebound there will confirm the expected pullback and drive once again the action above 1268 (R1). The picture remains positive since the precious metal is printing higher highs and higher lows and is trading above both the moving averages. Only a break below the previous low of 1235 (S1) may change the outlook.
• Support: 1257 (S1), 1235 (S2), 1224 (S3).
• Resistance: 1268 (R1), 1290 (R2), 1315 (R3).
Oil

• WTI continued moving lower yesterday but the decline was halted by the blue support line and both the moving averages. The probability for a higher low still exist and a rebound followed by a break of the 96.50 (R1) resistance barrier may target the recent high at 97.85 (R2). Nonetheless, both momentum studies are pointing downwards with the MACD lying below its signal line. A clear dip below the 95.00 (S1) support may be a first indication that the recent advance has reached its end. I remain neutral for now until both the price action and the oscillators give indications in the same direction.
• Support: 95.00 (S1), 94.00 (S2), 93.30 (S3).
• Resistance: 96.50 (R1), 97.85 (R2), 98.90 (R3).
BENCHMARK CURRENCY RATES - DAILY GAINERS AND LOSERS

Disclaimer: This information is not considered as investment advice or investment recommendation but instead a marketing communication. This material has not been prepared in accordance with legal requirements designed to promote the independence of investment research, and that it is not subject to any prohibition on dealing ahead of the dissemination of investment research. IronFX may act as principal (i.e. the counterparty) when executing clients’ orders.
This material is just the personal opinion of the author(s) and client’s investment objective and risks tolerance have not been considered. IronFX is not responsible for any loss arising from any information herein contained. Past performance does not guarantee or predict any future performance. Redistribution of this material is strictly prohibited. Risk Warning: Forex and CFDs are leveraged products and involves a high level of risk. It is possible to lose all your capital. These products may not be suitable for everyone and you should ensure that you understand the risks involved. Seek independent advice if necessary. IronFx Financial Services Limited is authorised and regulated by CySEC (Licence no. 125/10). IronFX UK Limited is authorised and regulated by FCA (Registration no. 585561). IronFX (Australia) Pty Ltd is authorized and regulated by ASIC (AFSL no. 417482)