
After its miserable performance last week, the dollar turned around and gained modestly against several currencies overnight. Its biggest gains were against the yen, after the Bank of Japan surprised the market by doubling one lending facility to JPY 7tn, and stating that individual banks can borrow twice as much low-interest money as they previously could under a second facility. While the efficacy of the move is questionable – companies already have record amounts of cash and deposits, so funding constraints are not necessarily a constraint on investment – nonetheless the move is a sign that the BoJ is concerned about Japan’s weak growth after the disappointing Q4 GDP data and is committed to supporting the economy as much as possible. That increases the likelihood that it will decide to accelerate its expansion of the monetary base after the consumption tax hike in April, which would be JPY-negative. Indeed, a recent Bloomberg survey shows 25 out of 34 economists forecast such a move will take place by the end of September, with 13 of those forecasting a move by end-June. I also expect that they will and that the move will further boost USD/JPY (that is, weaken the yen).
The AUD/USD was little changed after the release of the minutes of the latest Reserve Bank of Australia meeting. The minutes said the members “commenced their discussion of the domestic economy by focusing on the higher-than-expected reading for consumer price inflation in the December quarter,” which is not a good sign if you’re looking for further easing. About the AUD, they noted that it had depreciated further since the December meeting and said “if sustained, a lower exchange rate would be expansionary for economic activity and assist in achieving balanced growth of the economy.” This was in contrast to the statement in December, when they said that “members agreed that (the exchange rate) remained uncomfortably high and a lower level would likely be needed to achieve balanced growth in the economy.” In other words, the RBA felt at the December meeting (when AUD/USD was at 0.9122 the AUD TWI was at 69.7) that further depreciation was necessary, but by the time of the February meeting (when AUD/USD was at 0.8937 and the AUD TWI was at 68.6) that sufficient depreciation had been achieved. Personally I don’t think the decline in AUD since December has been that significant and I think the country’s terms of trade are still deteriorating. When I read reports about iron ore stockpiles in China reaching record highs, I can’t be optimistic about the AUD.
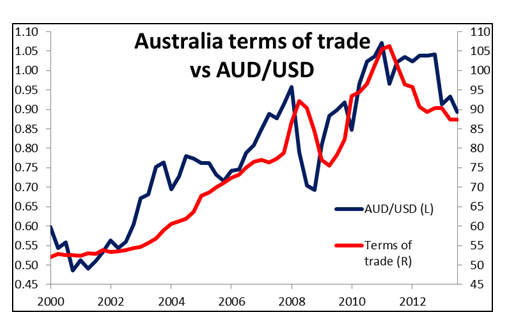 AUD/USD Terms Of Trade" title="AUD/USD Terms Of Trade" width="474" height="242">
The main event on the European agenda today is the German Zew survey for February. The current situation index is expected to rise to 44.0 from 41.2 in January, while the expectations index is forecast to fall slightly to 61.5 from 61.7. Last month, the expectations index came out first and was below expectations, sending the EUR/USD lower. But, a few minutes later the current situation index came better than expected and the EUR/USD recovered the lost ground. The Eurozone current account balance for December is also coming out, but no estimate is available. Sweden’s CPI for January is expected to remain at +0.1% yoy.

From the UK, the nation’s CPI is expected to have fallen 0.5% mom in January vs a +0.4% rise in December. However, this will keep the headline yoy rate unchanged at +2.0% and drive the core yoy rate higher at +1.9% from +1.7% previously. The UK PPI for the same month is expected to have seen no change for a second consecutive month. Figures like these are not likely to have a material impact on the GBP.
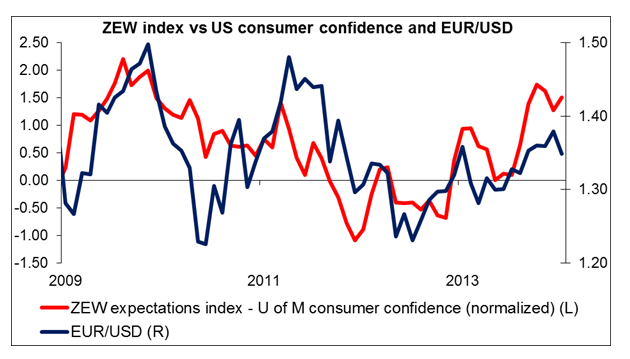 EUR/USD vs. ZEW Index" title="US Consumer Confiden & EUR/USD vs. ZEW Index" width="474" height="242">
In US, the Fed will hold an open meeting to discuss banking supervision. As for the indicators, the Empire state manufacturing survey for February is expected to fall slightly to 9.00 from 12.51 in January, but as the January reading was a sharp and unexpected rise from 0.98 in December, I wouldn’t expect a modest decline to have a negative impact on USD. The National association of Home Builders (NAHB) housing market index for February is estimated to stay at 56. We also get the revisions of the US CPI. Each year ahead of the release of the January CPI, seasonal adjustment factors are recalculated to reflect price movements from the completed calendar year.
Besides Governor Kuroda, we have three ECB speakers on Tuesday’s schedule: ECB Chief Economist Peter Praet and Governing Council members Erkki Liikanen and Luis Maria Linde.
The Market
 EUR/USD Hour Chart" title="EUR/USD Hour Chart" width="474" height="242">
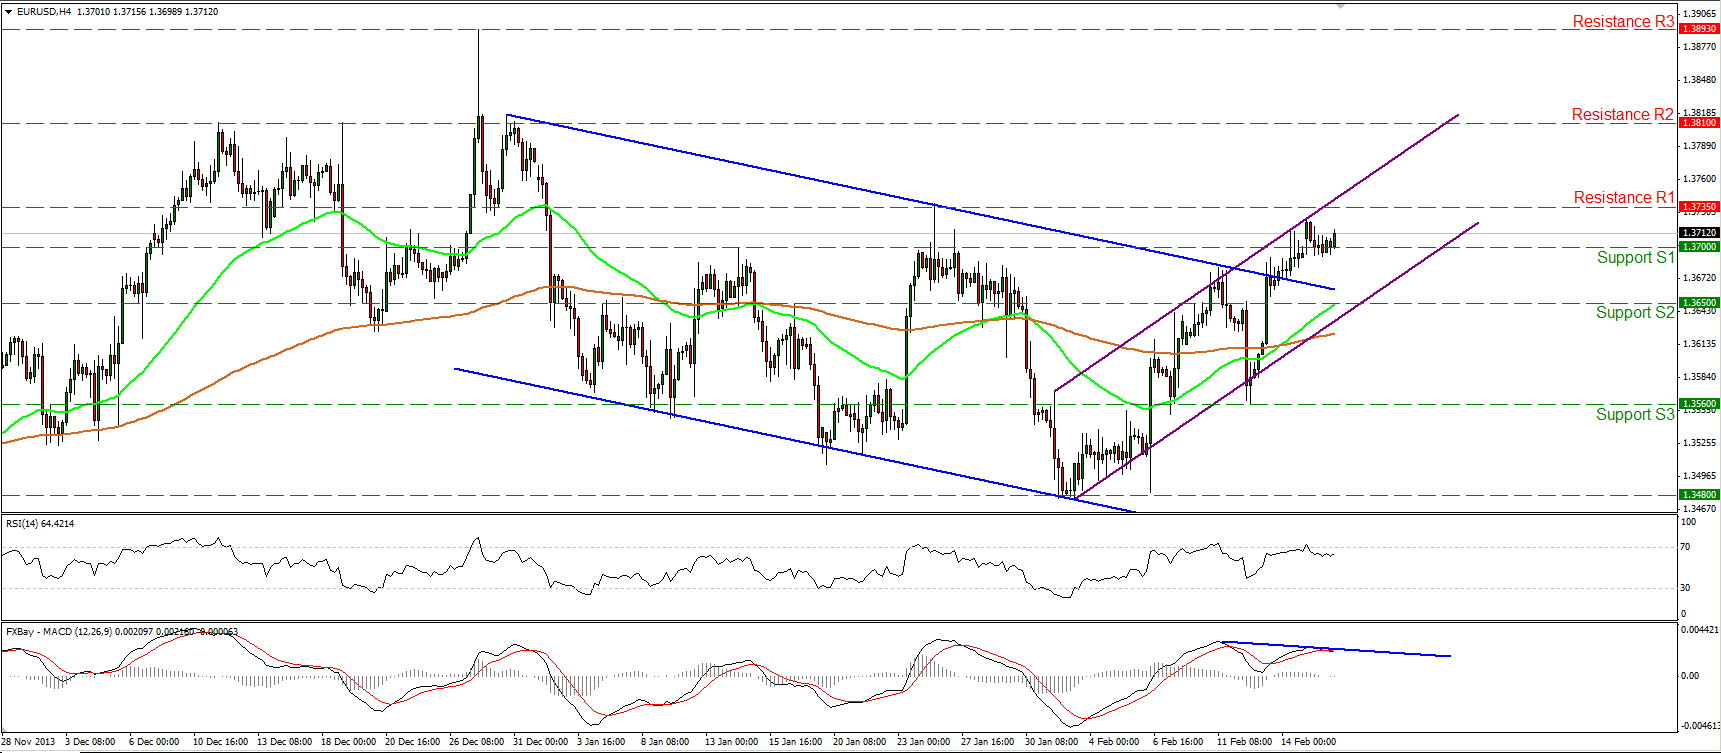
The EUR/USD continued consolidating within the resistance area between the support of 1.3700 (S1) and the resistance at 1.3735 (R1). A clear upward violation of the 1.3735 (R1) hurdle may open the way towards the next one at 1.3810 (R2). Considering negative divergence between the MACD and the price action, further consolidation or a pullback, towards the lower boundary of the upward sloping channel cannot be ruled out. On the downside, a dip below the lower boundary of the upward purple channel and the support at 1.3650 (S2) will give a neutral outlook, while a penetration below the previous low at 1.3560 (S3) may turn the short-term picture negative again.
• Support: 1.3700 (S1), 1.3650 (S2), 1.3560 (S3).
• Resistance: 1.3735 (R1), 1.3810 (R2), 1.3893 (R3).
 EUR/JPY Hour Chart" title="EUR/JPY Hour Chart" width="474" height="242">
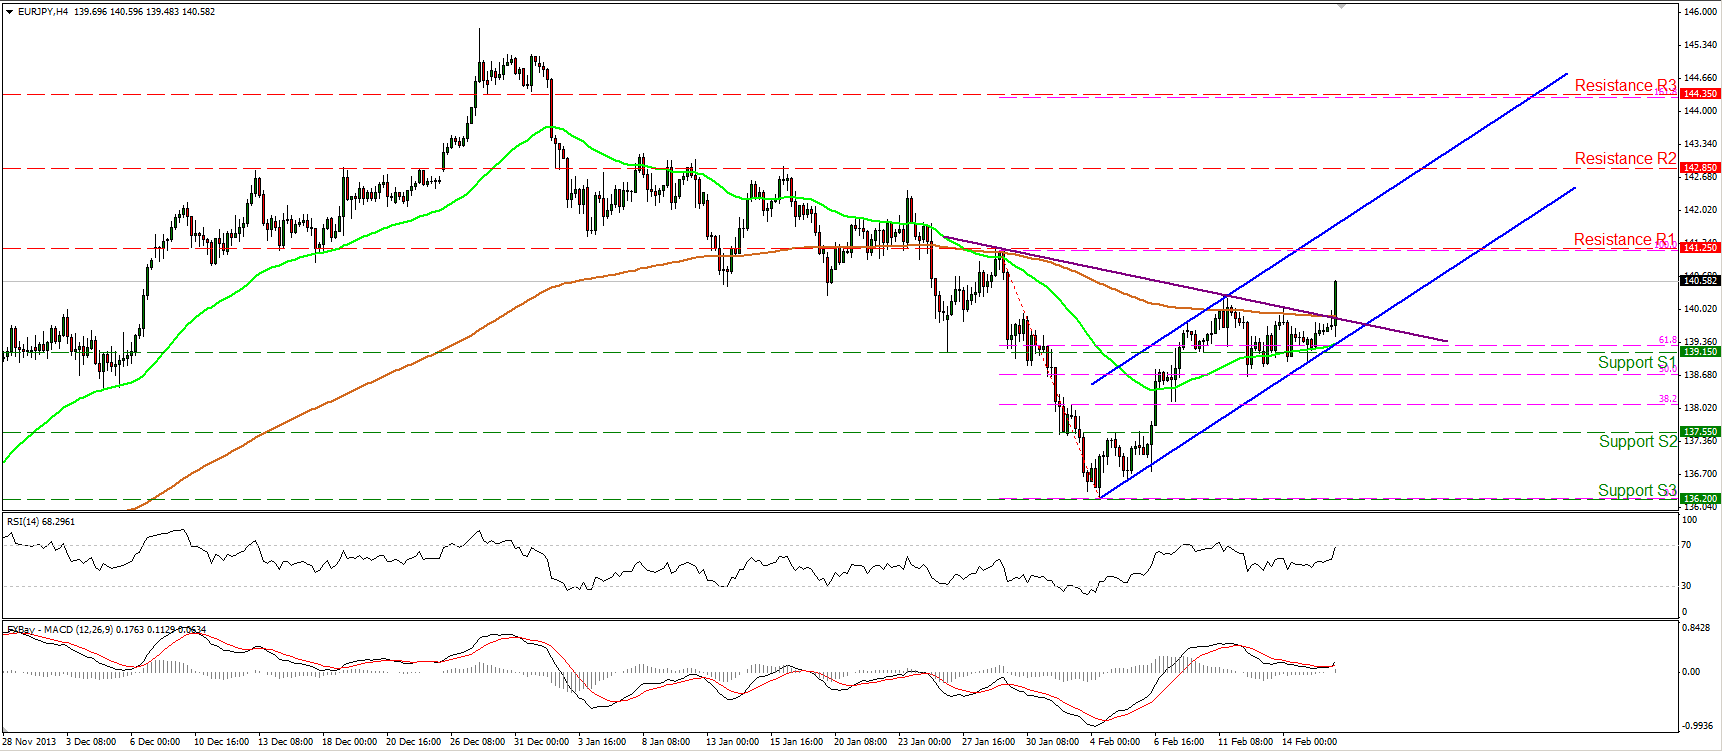
The EUR/JPY violated the neckline of a possible “inverted head and shoulders” formation and is currently heading towards the 141.25 (R1) resistance level. A violation of that hurdle may confirmed the reversal formation and trigger further extensions towards the 144.35 (R3) barrier which coincides with the 161.8% Fibonacci extension level of the 29th Jan.- 4th Feb. bearish wave. On the downside, a break below the 139.15 (S1) may signal that the formation was not as valid as we thought and turn the picture negative again.
• Support: 139.15 (S1), 137.55 (S2), 136.20 (S3)
• Resistance: 141.25 (R1), 142.85 (R2), 144.35 (R3).
 GBP/USD Hour Chart" title="GBP/USD Hour Chart" width="474" height="242">
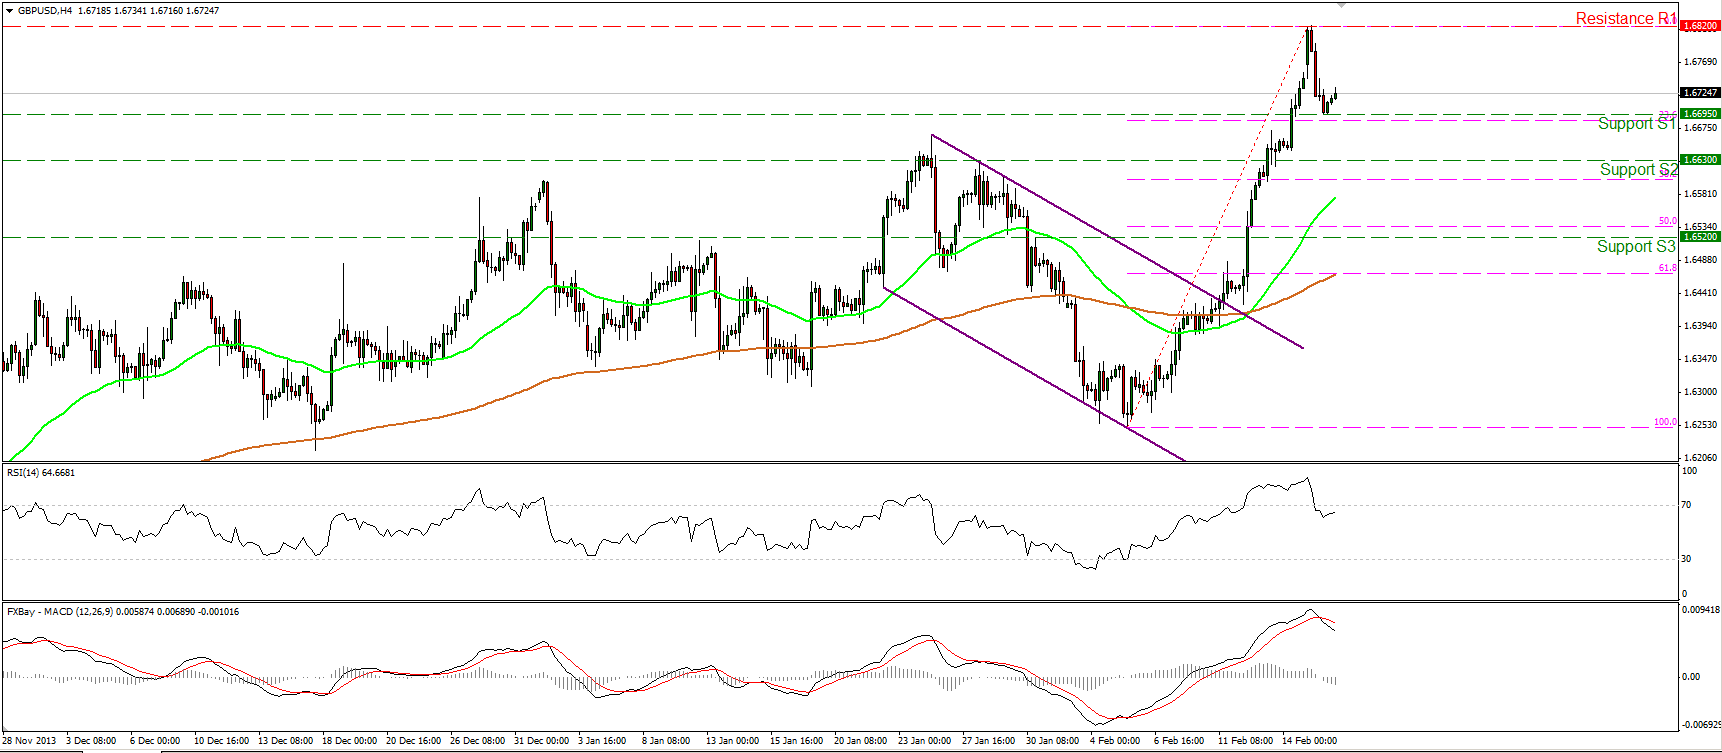
The GBP/USD moved lower on Monday after finding resistance at 1.6820 (R1). The decline was halted by the support at 1.6695 (S1), near the 23.6% Fibonacci retracement level of last week’s rally. If the bulls are strong enough to regain momentum and overcome the resistance at 1.6820 (R1), I would expect them to target the next one at 1.6885 (R2). The MACD although in a bullish territory, lies below its trigger line, thus it’s possible that the puillback may continue. On the daily chart, the longer term uptrend has resumed after the break of the 1.6630 obstacle.
• Support: 1.6695 (S1), 1.6630 (S2), 1.6520 (S3).
• Resistance: 1.6820 (R1), 1.6885 (R2), 1.7000 (R3).
Gold

Gold moved lower after hitting 1332 (R1). The outlook of the precious metal remains positive and a break above that resistance may drive the action higher, towards the next resistance at 1360 (R2). However the RSI seems ready to cross below 70, while the MACD, although in bullish territory, seems ready to cross below its trigger line, so it seems more likely to me that the downward corrective wave continues. The only grey spot in gold’s picture is that on the daily chart, the precious metal is still testing the 200-day moving average.
• Support: 1315 (S1), 1290 (S2), 1270 (S3).
• Resistance: 1332 (R1), 1360 (R2), 1376 (R3).
Oil

WTI moved above the 100.55 barrier and is currently trading between that support and the resistance of 101.35 (R1). A clear close above that resistance may signal the completion of a “double bottom” formation on the daily chart and have larger bullish implications. On the downside only a break below the blue uptrend line and the 98.80 (S2) support would be a reason to reconsider our analysis.
• Support: 100.55 (S1), 98.80 (S2), 96.50 (S3).
• Resistance: 101.35 (R1), 102.00 (R2), 103.15 (R3).
BENCHMARK CURRENCY RATES - DAILY GAINERS AND LOSERS

MARKETS SUMMARY
Disclaimer: This information is not considered as investment advice or investment recommendation but instead a marketing communication. This material has not been prepared in accordance with legal requirements designed to promote the independence of investment research, and that it is not subject to any prohibition on dealing ahead of the dissemination of investment research. IronFX may act as principal (i.e. the counterparty) when executing clients’ orders. This material is just the personal opinion of the author(s) and client’s investment objective and risks tolerance have not been considered.
IronFX is not responsible for any loss arising from any information herein contained. Past performance does not guarantee or predict any future performance. Redistribution of this material is strictly prohibited. Risk Warning: Forex and CFDs are leveraged products and involves a high level of risk. It is possible to lose all your capital. These products may not be suitable for everyone and you should ensure that you understand the risks involved. Seek independent advice if necessary. IronFx Financial Services Limited is authorised and regulated by CySEC (Licence no. 125/10). IronFX UK Limited is authorised and regulated by FCA (Registration no. 585561). IronFX (Australia) Pty Ltd is authorized and regulated by ASIC (AFSL no. 417482)